Search Results
Showing results 1 to 3 of 3
Plot the Dot: A Graphical Approach to Density
Source Institutions
In this activity, learners work in groups to determine the mass and volume of four samples: glass marbles, steel washers or nuts, pieces of pine wood, and pieces of PVC pipe.
Sizing Up Temperature
Source Institutions
In this activity, learners explore Charles' Law in a syringe.
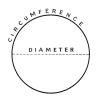
Pi Graph
Source Institutions
In this activity, learners use a straight line to learn about circles. Learners measure and record the diameter and circumference of different sized cylindrical objects on a chart.