Search Results
Showing results 1 to 7 of 7
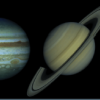
Our Solar System to Scale
Source Institutions
In this activity, learners plan and create a 24-foot long, two-dimensional model of our solar system, and compare and contrast the differences between planets and the sun.

Heat Capacity: Can't Take the Heat?
Source Institutions
Why is ocean water sometimes the warmest when the average daily air temperature starts to drop? In this activity, learners explore the differing heat capacities of water and air using real data.
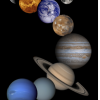
Habitable Worlds
Source Institutions
In this group activity, learners consider environmental conditions—temperature, presence of water, atmosphere, sunlight, and chemical composition—on planets and moons in our solar system to determine
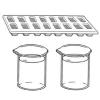
Sinking Water
Source Institutions
In this experiment, learners float colored ice cubes in hot and cold water.
Inverted Bottles
Source Institutions
In this activity, learners investigate convection by using food coloring and water of different temperatures.

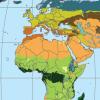
Discovering Rainforest Locations
Source Institutions
In this activity, learners will examine various world data maps to combine the information and predict which areas could be tropical rainforests.
Discovering Rainforest Locations
Source Institutions
In this activity, learners will examine various world data maps to combine the information and predict which areas could be tropical rainforests.