Search Results
Showing results 1 to 10 of 10

It's a Gas, Man
Source Institutions
In this activity, learners discover if carbon dioxide has an effect on temperature.
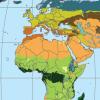
Discovering Rainforest Locations
Source Institutions
In this activity, learners will examine various world data maps to combine the information and predict which areas could be tropical rainforests.
My Angle on Cooling: Effects of Distance and Inclination
Source Institutions
In this activity, learners discover that one way to cool an object in the presence of a heat source is to increase the distance from it or change the angle at which it is faced.

Weather and Climate: What's the Difference?
Source Institutions
This lesson plan enables learners to explore the differences between weather and climate.
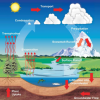
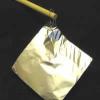
Weather Stations: Phase Change
Source Institutions
In this activity, learners observe the water cycle in action! Water vapor in a tumbler condenses on chilled aluminum foil — producing the liquid form of water familiar to us as rain and dew.

That Sinking Feeling
Source Institutions
In this quick activity, learners observe how salinity and temperature affect the density of water, to better understand the Great Ocean Conveyor.
Sizing Up Temperature
Source Institutions
In this activity, learners explore Charles' Law in a syringe.
Weather Stations: Winds
Source Institutions
In this activity, learners use a toaster to generate wind and compare the appliance's heat source to Jupiter's own hot interior. Learners discover that convection drives wind on Jupiter and on Earth.

Heat Capacity: Can't Take the Heat?
Source Institutions
Why is ocean water sometimes the warmest when the average daily air temperature starts to drop? In this activity, learners explore the differing heat capacities of water and air using real data.

Discovering Rainforest Locations
Source Institutions
In this activity, learners will examine various world data maps to combine the information and predict which areas could be tropical rainforests.