Search Results
Showing results 1 to 14 of 14
Changing the Density of a Liquid: Adding Salt
Source Institutions
Learners see that a carrot slice sinks in fresh water and floats in saltwater.

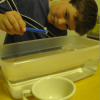
How Much Water is in that Cloud?
Source Institutions
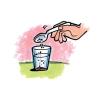
In this activity, learners working in pairs saturate a cotton ball using water drops from an eyedropper to demonstrate the high water capacity of clouds.
Salt 'n Lighter
Source Institutions
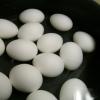
In this activity, learners discover that as the salinity of water increases, the density increases as well. Learners prove this by attempting to float fresh eggs in saltwater and freshwater.
Be a Plumber
Source Institutions
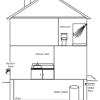
In this activity (located on page 6 of the PDF), learners explore the ways people access water in their homes.
Gravity Fountains
Source Institutions
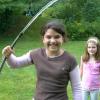
This activity (located on page 3 of the PDF under GPS: Glaciers Activity) is a full inquiry investigation into the forces of gravity and air pressure.
Go with the Flow
Source Institutions
Learners draw comic-style pictures to show the water cycle. From a starting picture, one learner draws what happens to the water in the next panel, then passes the comic strip to another learner.

That Sinking Feeling
Source Institutions
In this quick activity, learners observe how salinity and temperature affect the density of water, to better understand the Great Ocean Conveyor.
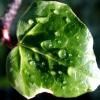
Leaf it to Me
Source Institutions
In this activity, learners observe the effect of transpiration as water is moved from the ground to the atmosphere.
Shrinking Cups
Source Institutions
This is a quick activity (on page 2 of the PDF under Gecko Feet Activity) about the forces of gravity and surface tension and how their behavior is influenced by size.
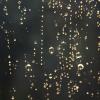
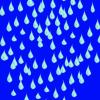
The Rain Man
Source Institutions
In this activity, learners observe the hydrologic cycle in action as water evaporates and condenses to form rain right before their eyes.
Build A Hydrometer
Source Institutions
In this activity, learners will explore how a hydrometer works by building a working model and conducting experiments.

Heat Capacity: Can't Take the Heat?
Source Institutions
Why is ocean water sometimes the warmest when the average daily air temperature starts to drop? In this activity, learners explore the differing heat capacities of water and air using real data.
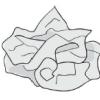
Crumple a Watershed
Source Institutions
Learners gain an intuitive knowledge of the physical aspects of watersheds by creating their own watershed models.
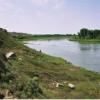
Mystery of the Disappearing Cottonwoods
Source Institutions
Learners will explore the scientific mystery behind a disappearing group of trees by examining data and attempting to explain the decline.