Search Results
Showing results 1 to 8 of 8
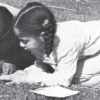
Bean Bugs
Source Institutions
In this outdoor biology and math activity, learners estimate the size of a population of organisms too numerous to count.

Mapping Sea Level Rise
Source Institutions
In this activity related to climate change, learners create and explore topographical maps as a means of studying sea level rise.
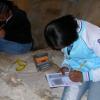
Fossil Age Estimation Model
Source Institutions
In this activity (page 1 of the PDF under SciGirls Activity: Dinosaurs), learners will model how paleontologists estimate the age of fossil discoveries by extracting “fossil” playing cards from newspa
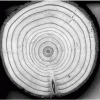
Trees: Recorders of Climate Change
Source Institutions
In this activity, learners are introduced to tree rings by examining a cross section of a tree, also known as a “tree cookie.” They discover how tree age can be determined by studying the rings and ho
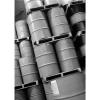
Computation and Estimation: Roll Out The Barrel
Source Institutions
In this math lesson, learners apply mathematical modeling to solve a real-world storage problem, in which a manufacturing company is given two options for storing oil barrels.
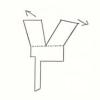
Statistics: Whirlybirds
Source Institutions
In this math lesson, learners measure, predict and determine the frequency of an event as it relates to how close Whirlybirds land to a target.

Statistics: Something Fishy
Source Institutions
In this math lesson, learners apply the concepts of ratio and proportion to the capture-recapture statistical procedure.

Sustainable Grazing
Source Institutions
In this activity, learners investigate the food, water, and space needs of common livestock animals.