Search Results
Showing results 1 to 20 of 24
The Geophysical Light/Dark Cycle
Source Institutions
This is an activity (located on page 131 of the PDF) related to sleep and circadian rhythms as well as space travel.
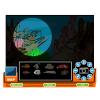
Underwater ROV
Source Institutions
In this online Flash game, learners will explore a coral reef using an underwater remotely operated vehicle (ROV).

Arctic Sea Ice
Source Institutions
In this activity, learners explore how the area of Arctic sea ice has changed over recent years. First, learners graph the area of Arctic sea ice over time from 1979 to 2007.
Let's Count Humpback Whales: Environmental Effects on Population
Source Institutions
In this activity, learners use whale count data from the Hawaiian Islands Humpback Whale National Marine Sanctuary to compare whale counts in relation to environmental factors.
Catch & Release II: It's Catching On!
Source Institutions
Throw that fish back? A new generation of ethical anglers concerned about conserving resources is participating in "catch and release" fishing. How is this going?

Building Bingo
Source Institutions
In this on site "field trip" activity (located on pages 6-9 of PDF), learners get hands-on experience identifying building materials by playing "Building Bingo".
Gravestone Weathering
Source Institutions
In this activity (located on pages 9-14 of PDF), learners visit a cemetery to examine the distinguishing characteristics of rock weathering.

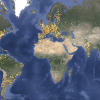
Mapping Greenhouse Gas Emissions Where You Live
Source Institutions
In this lesson plan, learners examine some of the of greenhouse gas emissions sources in their community.
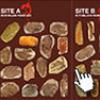
Prehistoric Climate Change
Source Institutions
In this online interactive, learners use fossils to infer temperatures 55 million years ago, at the sites where the fossils were found.
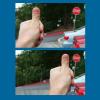
Experiencing Parallax With Your Thumb
Source Institutions
In this activity, learners investigate parallax, a method used to measure distances to stars and planets in the solar system.
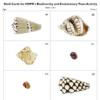
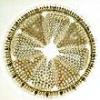
Biodiversity and Evolutionary Trees
Source Institutions
In this interactive activity, learners analyze seashells to explore phylogeny and evolution. Learners identify similar and dissimilar seashells to create a phylogenetic tree.

Coral Snapshots: Biodiversity in Marine Protected Areas
Source Institutions
In this data activity, learners analyze data from coral reef snapshots taken by scientists at the Virginia Institute of Marine Science.
Globe at Night
Source Institutions
In this international citizen science activity, learners measure their night sky brightness and submit their observations into an online database.
Fish Eyes: More than Meets the Eye
Source Institutions
In this data collection and analysis activity, learners evaluate fish physiology and ecology using vision research data from Dr.
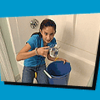
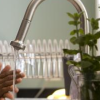
Shower Estimation
Source Institutions
In this activity, learners calculate their water usage (in cups and galloons) during an average shower. Learners also chart and analyze water usage during showers in their households.
The Return of El Nino
Source Institutions
In this activity related to climate change and data analysis, learners examine temperature and precipitation data to determine if climate variations are due to El Niño.
Diatom Ooze: Ooze Clues
Source Institutions
In this activity, learners will plot the distribution of various oozes using information from sediment maps.
Home Water Audit
Source Institutions
This activity offers learners and their families several ways to raise their awareness together about home water.
Harmful Algal Blooms: In Full Bloom
Source Institutions
In this activity, learners will investigate the impacts of harmful phytoplankton using NOAA's Coastal Services Center Harmful Algal Bloom Forecasting (HABF) Project data.
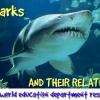
Sharks: Taking a Bite Out of The Myth
Source Institutions
In this activity, learners will explore trends in shark populations using shark landing data from the National Marine Fisheries Service.