Search Results
Showing results 1 to 20 of 74
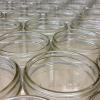
Hot Stuff!: Investigation #4
Learners test two jars containing soil, one covered and one open, for changes in temperature. After placing the jars in the Sun, learners discover that the covered jar cools down more slowly.

Dripping Wet or Dry as a Bone?
Learners investigate the concept of humidity by using a dry and wet sponge as a model. They determine a model for 100% humidity, a sponge saturated with water.
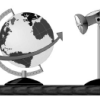
The Geophysical Light/Dark Cycle
Source Institutions
This is an activity (located on page 131 of the PDF) related to sleep and circadian rhythms as well as space travel.
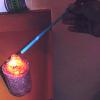
Hot Stuff!: Investigation #1
Learners test two jars, one containing plain air and one containing carbon dioxide gas, to see their reactions to temperature changes.

A Funny Taste
Source Institutions
In this activity, learners explore the different salinities of various sources of water by taste-testing.
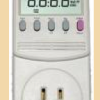
Plugged in to CO2
Source Institutions
In this activity, learners investigate various appliances and electronics, discovering how much energy each uses and how much carbon dioxide (CO2) is released to produce that energy.
Underwater ROV
Source Institutions
In this online Flash game, learners will explore a coral reef using an underwater remotely operated vehicle (ROV).

Good News: We're on the Rise!
Learners build a simple aneroid barometer to learn about changes in barometric pressure and weather forecasting. They observe their barometer and record data over a period of days.

A Recipe for Air
Learners use M&Ms® (or any other multi-color, equally-sized small candy or pieces) to create a pie graph that expresses the composition of air.
Composting
Source Institutions
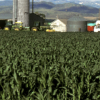
In this environmental science activity, learners research what is essential for plant life and the necessary components of soil to support plants.
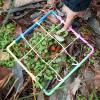
Counting With Quadrants
Source Institutions
Millions of organisms can live in and around a body of water.

Arctic Sea Ice
Source Institutions
In this activity, learners explore how the area of Arctic sea ice has changed over recent years. First, learners graph the area of Arctic sea ice over time from 1979 to 2007.

It's a Gas, Man
Source Institutions
In this activity, learners discover if carbon dioxide has an effect on temperature.
Let's Count Humpback Whales: Environmental Effects on Population
Source Institutions
In this activity, learners use whale count data from the Hawaiian Islands Humpback Whale National Marine Sanctuary to compare whale counts in relation to environmental factors.
Arctic Story Puzzles
Source Institutions
This activity has three story puzzles learners can solve to learn about life in the Arctic.
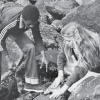
Rock Pioneers
Source Institutions
In this outdoor activity/field trip, learners investigate organisms that live along the ocean's rocky coast.

The Scoop on Scallops
Source Institutions
In this data analysis activity, learners quantify the abundance and distribution of sea scallops in and adjacent to the Mid-Atlantic closed areas.
Sea State: Forecast Conditions at Sea
Source Institutions
In this oceanography and data collection activity, learners cast real time sea state conditions using buoys from NOAA's National Data Buoy Center.
Hexagon Hunt
Source Institutions
This activity gets learners looking at 6-sided shapes in nature, including the cells of a beehive, as well as other shapes.
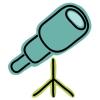
Make a Telescope
Source Institutions
In this optics activity, learners make a simple telescope using two lenses and a cardboard tube. Learners construct the telescope and then calculate its magnification.