Search Results
Showing results 1 to 20 of 136
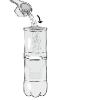
Cleaning with Dirt
Source Institutions
Learners build a filter from old soda bottles and dirt. They create polluted water, and pour it through their filter to clean it.
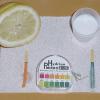
Acid (and Base) Rainbows
Learners use red cabbage juice and pH indicator paper to test the acidity and basicity of household materials. The activity links this concept of acids and bases to acid rain and other pollutants.

A Funny Taste
Source Institutions
In this activity, learners explore the different salinities of various sources of water by taste-testing.

How Much Water is in that Cloud?
Source Institutions
In this activity, learners working in pairs saturate a cotton ball using water drops from an eyedropper to demonstrate the high water capacity of clouds.

The Rumblin' Road: Determining distance to a Thunderstorm
Source Institutions
In this activity, learners discover how to determine the distance to a lightning strike or nearby thunderstorm.
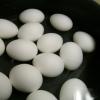
Salt 'n Lighter
Source Institutions
In this activity, learners discover that as the salinity of water increases, the density increases as well. Learners prove this by attempting to float fresh eggs in saltwater and freshwater.

Quadraphonic Wind
Source Institutions
In this activity, learners discover how the extent of various wind speeds changes in each of the four quadrants around a hurricane.
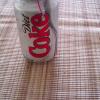
Diet Light
Source Institutions
In this quick activity, learners observe how the added sugar in a can of soda affects its density and thus, its ability to float in water.

Good News: We're on the Rise!
Learners build a simple aneroid barometer to learn about changes in barometric pressure and weather forecasting. They observe their barometer and record data over a period of days.

Acid Rain Effects
Learners conduct a simple experiment to model and explore the harmful effects of acid rain (vinegar) on living (green leaf and eggshell) and non-living (paper clip) objects.

Earth's Energy Cycle: Albedo
Source Institutions
In this activity, learners experiment and observe how the color of materials that cover the Earth affects the amounts of sunlight our planet absorbs.
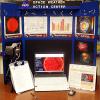
Space Weather Action Center
Source Institutions
In this interdisciplinary activity, learners create a Space Weather Action Center (SWAC) to monitor solar storms and develop real SWAC news reports.

Whose Fault Is It?
Source Institutions
In this seismic simulation, learners play a "who-dunnit" game to explore earthquakes.

It's a Gas, Man
Source Institutions
In this activity, learners discover if carbon dioxide has an effect on temperature.
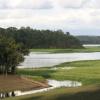
Coastal Erosion: Where's the Beach?
Source Institutions
Learners use beach profile data from a local beach or online data from Ocean City, Maryland to investigate coastal erosion and sediment transport.

Twirling in the Breeze
Source Institutions
In this engineering activity, learners build a device (an anemometer) to measure how fast the wind is blowing.

The Carbon Cycle and its Role in Climate Change: Activity 3
Source Institutions
In this activity, learners explore the human influences on the carbon cycle and examine how fossil fuels release carbon.
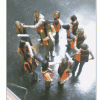
Running in Circles
Source Institutions
In this group activity, learners use some common objects and work together to simulate the Coriolis effect. During the challenge, learners make predictions and test different scenarios.
Amazon Water Cycle Roleplay
Source Institutions
In this creative roleplay activity, learners will explore the various processes of the water cycle using movement, sound, and props to aid in comprehension.
Make a Model Caldera
Source Institutions
In this quick activity (page 2 of PDF under GPS: Lava Flow Activity), learners will model how large depressions near the top of a volcano are formed by using an inflating and deflating balloon submerg