Search Results
Showing results 1 to 20 of 20

How Much Water is in that Cloud?
Source Institutions
In this activity, learners working in pairs saturate a cotton ball using water drops from an eyedropper to demonstrate the high water capacity of clouds.

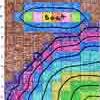
Quadraphonic Wind
Source Institutions
In this activity, learners discover how the extent of various wind speeds changes in each of the four quadrants around a hurricane.

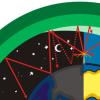
Earth's Energy Cycle: Albedo
Source Institutions
In this activity, learners experiment and observe how the color of materials that cover the Earth affects the amounts of sunlight our planet absorbs.

Arctic Sea Ice
Source Institutions
In this activity, learners explore how the area of Arctic sea ice has changed over recent years. First, learners graph the area of Arctic sea ice over time from 1979 to 2007.
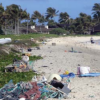
A Scientific Cleanup
Source Institutions
This is a comprehensive lesson plan on page 85 for a group cleanup trip to a local beach, lake or stream. Learners keep track of the types and amounts of trash picked up and analyze this information.
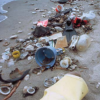
Trash Traits
Source Institutions
In this activity on page 24, learners perform experiments to examine whether or not trash can float, blow around, or wash away.

A Degrading Experience
Source Institutions
In this activity on page 27, learners perform an experiment to learn about how different types of marine debris degrade and how weather and sunlight affect the rate of degradation.
Waves and Tides
Source Institutions
In this 7-10 day investigation, learners develop an understanding of waves and tides and their motion through discussion, demonstration, and hands-on activities.
Mountains in the Sea
Source Institutions
In this 6-7 day investigation, learners begin with an introduction to seamounts that are present in the Gulf of Alaska.

The Daily Ups and Downs
Source Institutions
In this activity, learners graph 48 hourly air temperatures from a local weather observation site and observe the diurnal temperature variations.

It's the "Rain," Man
Source Institutions
In this weather forecasting activity, learners use common materials to construct a rain gauge and measure daily, monthly, and yearly rainfall.
Trees: Recorders of Climate Change
Source Institutions
In this activity, learners are introduced to tree rings by examining a cross section of a tree, also known as a “tree cookie.” They discover how tree age can be determined by studying the rings and ho

Drawing Conclusions
Source Institutions
In this weather forecasting activity, learners determine the location of cold and warm fronts on weather plot maps.
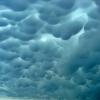
Head in the Clouds
Source Institutions
In this activity, learners create a CloudSpotter wheel and record the different types of clouds they observe twice daily over several days.
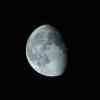
Moonlight Serenade
Source Institutions
In this activity, learners act as the Earth and observe how different angles between the Sun, Earth, and Moon affect the phases of the moon we see each month.

Forward Thinking
Source Institutions
In this activity, learners create their own weather forecast map.
AM in the PM
Source Institutions
In this activity, learners will listen to as many radio stations as possible to discover that AM radio signals can travel many hundreds of miles at night.

If Anyone Can, Icon
Source Institutions
In this activity, learners create their own icons for a forecast-at-a-glance poster for their classroom/learning space.
Water, Water Everywhere
Source Institutions
In this activity, learners estimate how much water they think can be found in various locations on the Earth in all its states (solid, liquid, and gas) to discover the different water ratios in the Ea
Off Base
Source Institutions
In this activity, learners explore the factors that tend to resist changes in pH of the ocean and why the ocean is becoming more acidic.