Search Results
Showing results 1 to 20 of 26
Measurement: How Many Noses Are in Your Arm?
Source Institutions
In this math lesson, learners apply the concepts of ratio and proportion to determine the length of the Statue of Liberty's torch-bearing arm.
Investigating Density Currents
Source Institutions
In this lab activity, learners explore how to initiate a density current. Learners measure six flasks with different concentrations of salt and water (colored blue).
Inverse Functions: Pennies, Pressure, Temperature, and Light
Source Institutions
The major goal of this math lesson is to have learners collect data from a variety of experiments, determine what models best fits their data, and explain why their models are best.
Linear Functions: Mystery Liquids
Source Institutions
In this math lesson, learners analyze the density of liquids in order to explore linear functions.
Polynomial and Rational Functions: Building Boxes
Source Institutions
In this math lesson, learners explore polynomial and rational function patterns.
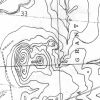
Blazing the Trail
Source Institutions
In this math lesson, learners estimate distances between landmarks and use a map and scales to determine the actual distances.
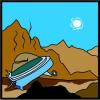
Chances Are: OH NO! Look Out Below for a UFO
Source Institutions
In this math lesson (on Page 13), learners predict and simulate the likelihood of an event occurring.
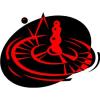
Chances Are: It's a Mystery to Me
Source Institutions
In this math lesson, learners extend their understanding of basic probability concepts as they learn to name all of the possible outcomes of an event as well as ways to express the likelihood of such

Statistics: Steppin' Out
Source Institutions
In this math lesson, learners construct box-and-whisker plots to analyze and compare data sets. Learners investigate whether or not long-legged people run faster than short-legged people.
Exploring Measurement
Source Institutions
In this "Sid the Science Kid" activity, learners use their bodies to measure a room. Instead of inches or feet, how many kids does it take to measure the length of a room?

Multi-Variable Relations: Stressed to the Breaking Point
Source Institutions
In this math lesson, learners explore the relationship between the thickness of a spaghetti bridge, the length of the bridge, and the amount of weight that can be supported by the bridge.
Number Sense and Computation: Food For Thought
Source Institutions
In this math lesson, learners identify and compare unit costs of given items. Learners use computation skills, problem solving and number sense to find the cost of an ounce of cereal.
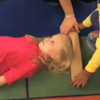
Measurement: Sand Babies
Source Institutions
In this math lesson, learners explore and investigate measurement using standard and non-standard units.
Patterns and Relationships: Struts 'n Stuff
Source Institutions
In this math lesson, learners identify the relationship between the number of sides in a regular polygon and the number of struts needed to make each polygon rigid.
Measurement: It Takes Ten
Source Institutions
In this math lesson, learners practice estimation and measurement skills as they move from station to station calculating length, volume, weight, and area.

Tree-mendous Plots
Source Institutions
In this math lesson, learners record and graph plant growth and interpret data. Learners plant seeds, and once the seeds sprout, record the change in height of the plants for several days.
Algebra: Aw Chute!
Source Institutions
In this math lesson, learners determine and compare the rate of descent of various learner-constructed parachutes. Learners construct parachutes that will have maximum hang times.
Patterns and Functions: Fill 'er Up
Source Institutions
In this math lesson, learners predict, interpret, and sketch graphs of functions related to the shapes of bottles. A measure of water is poured into a container.
Computation and Estimation: Roll Out The Barrel
Source Institutions
In this math lesson, learners apply mathematical modeling to solve a real-world storage problem, in which a manufacturing company is given two options for storing oil barrels.
Rates of Change: Bottles and Divers
Source Institutions
In this math lesson (page 2 of the PDF), learners use bottles of various shapes to explore the abstract concept of rate of change.