Search Results
Showing results 1 to 13 of 13

The Rumblin' Road: Determining distance to a Thunderstorm
Source Institutions
In this activity, learners discover how to determine the distance to a lightning strike or nearby thunderstorm.

Incredible Shrinking Shapes
Source Institutions
In this activity, learners get hands-on experience with ratios and scaling while making their own jewelry out of recycled plastic containers.
Sea State: Forecast Conditions at Sea
Source Institutions
In this oceanography and data collection activity, learners cast real time sea state conditions using buoys from NOAA's National Data Buoy Center.
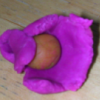
Atoms and Matter (K-2)
Source Institutions
In this activity, learners explore atoms as the smallest building blocks of matter. With adult help, learners start by dividing play dough in half, over and over again.
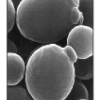
Energy For Life
Source Institutions
In this activity about the relationship between food and energy (page 1 of PDF), learners observe and quantify the growth of yeast when it is given table sugar as a food source.
Fish Eyes: More than Meets the Eye
Source Institutions
In this data collection and analysis activity, learners evaluate fish physiology and ecology using vision research data from Dr.
Haunted by Hurricanes: Use Data to Learn About Hurricanes
Source Institutions
In this activity, learners will determine if the frequency and intensity of hurricanes are changing using real data from the National Hurricane Center.
The Return of El Nino
Source Institutions
In this activity related to climate change and data analysis, learners examine temperature and precipitation data to determine if climate variations are due to El Niño.
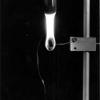
Burn a Peanut
Source Institutions
In this activity, learners burn a peanut, which produces a flame that can be used to boil away water and count the calories contained in the peanut.
Sizing Up Temperature
Source Institutions
In this activity, learners explore Charles' Law in a syringe.
Cool It
Source Institutions
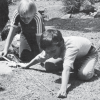
In this outdoor activity/game, learners use thermometers to simulate how lizards survive in habitats with extreme temperatures.

Heat Capacity: Can't Take the Heat?
Source Institutions
Why is ocean water sometimes the warmest when the average daily air temperature starts to drop? In this activity, learners explore the differing heat capacities of water and air using real data.

The Dead Zone: A Marine Horror Story
Source Institutions
In this environmental science and data analysis activity, learners work in groups to track a Dead Zone (decreased dissolved oxygen content of a body of water) using water quality data from the Nutrien