Search Results
Showing results 361 to 380 of 642
Liesegang Rings
Source Institutions
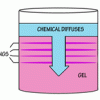
This display shows slow chemical reactions in colorful crystal formations known as Liesegang Rings. These reactions are similar to those forming the rings in agates.
Filtration Investigation
Source Institutions
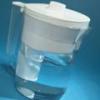
In this activity, learners explore how engineering has developed various means to remove impurities from water.
Great Steamboat Race
Source Institutions
In this outdoor activity, learners race small boats, made of cork, balsa wood, popsicle sticks etc., to investigate the rate and direction of currents in a stream or creek.

Saguaro Nest Cavities
Source Institutions
This activity (on page 3 of the PDF under GPS: Cactus Activity) is a full inquiry investigation into how some desert birds keep their cool.
Exploring Magnetic Field Lines
Source Institutions
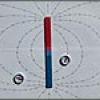
In this activity, learners explore the magnetic field of a bar magnet as an introduction to understanding Earth's magnetic field. First, learners explore and play with magnets and compasses.

From the Ground Up
Source Institutions
In this plant science activity, learners conduct four experiments to observe how plants respond to sunlight and gravity.
Exploring the Solar System: Magnetic Fields
Source Institutions
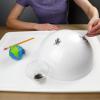
The "Exploring the Solar System: Magnetic Fields" activity shows participants how scientists can use tools to study the invisible magnetic fields of Earth, the Sun, and other objects in the universe.

Oil Spot Photometer
Source Institutions
In this math activity related to light, learners assemble a photometer and use it to estimate the power output of the Sun.
Exploring the Universe: Star Formation
Source Institutions
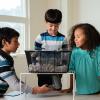
In this activity, participants will learn how stars form from the dust and gas that exists in space clumping together.
What is in the Water?
Source Institutions
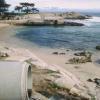
In this activity, learners use open inquiry to learn about the process of science as well as gain experience regarding the Law of Conservation of Mass, dissolution, and density.
Angles and Area
Source Institutions
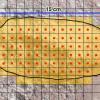
In this activity (page 10 of PDF), learners approximate the area of the uppermost cross section of an impact crater using a variety of square grids.
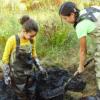
Bury Me Not!
Source Institutions
This activity (page 2 of the PDF under SciGirls Activity: Bogs) is a full inquiry investigation into decomposition.
Windmills
Source Institutions
In this physics activity (page 8-9 of the PDF), learners will explore wind energy. They will build their own windmill and see how energy from wind can be converted into a useable form.
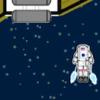
So Many Parts
Source Institutions
In this online Flash game and spacewalk mission simulation, learners are challenged to repair parts of a space station while balancing their oxygen and fuel use carefully.
Stick to It: Adhesion II
Source Institutions
Water sticks to all kinds of things in nature — flowers, leaves, spider webs - and doesn't stick to others, such as a duck's back.
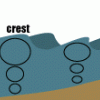
Water on the Move: Wind and Waves
Source Institutions
In this simple activity, learners explore ocean waves. To find out if water moves forward toward the shore, learners create waves in a simulated ocean (small aquarium tank of water).
Butterflies in Space
Source Institutions
The Butterflies in Space Teacher's Guide uses "life in space" to encourage learners to conduct their own open-ended scientific investigations.
We Have Capture!
Source Institutions
Using simple materials, learners will construct the end effector (grasping device) of a robotic arm and use the device to capture and pick up an object.
Nature Drawing
Source Institutions
In this family or group activity, learners create a nature journal by visiting a local nature center or backyard, observing creatures in their natural habitats, and sketching what they see.

How Might Elevated CO2 Affect Plants
Source Institutions
In this activity, learners conduct an experiment to investigate the effect of elevated levels on CO2 on plant growth.
