Search Results
Showing results 1 to 20 of 65
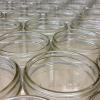
Hot Stuff!: Investigation #4
Learners test two jars containing soil, one covered and one open, for changes in temperature. After placing the jars in the Sun, learners discover that the covered jar cools down more slowly.

Dripping Wet or Dry as a Bone?
Learners investigate the concept of humidity by using a dry and wet sponge as a model. They determine a model for 100% humidity, a sponge saturated with water.
Hot Stuff!: Investigation #1
Learners test two jars, one containing plain air and one containing carbon dioxide gas, to see their reactions to temperature changes.

A Funny Taste
Source Institutions
In this activity, learners explore the different salinities of various sources of water by taste-testing.
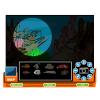
Underwater ROV
Source Institutions
In this online Flash game, learners will explore a coral reef using an underwater remotely operated vehicle (ROV).

Good News: We're on the Rise!
Learners build a simple aneroid barometer to learn about changes in barometric pressure and weather forecasting. They observe their barometer and record data over a period of days.

Earth's Energy Cycle: Albedo
Source Institutions
In this activity, learners experiment and observe how the color of materials that cover the Earth affects the amounts of sunlight our planet absorbs.

Arctic Sea Ice
Source Institutions
In this activity, learners explore how the area of Arctic sea ice has changed over recent years. First, learners graph the area of Arctic sea ice over time from 1979 to 2007.

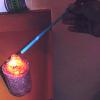
It's a Gas, Man
Source Institutions
In this activity, learners discover if carbon dioxide has an effect on temperature.
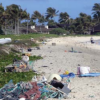
Coastal Erosion: Where's the Beach?
Source Institutions
Learners use beach profile data from a local beach or online data from Ocean City, Maryland to investigate coastal erosion and sediment transport.
Arctic Story Puzzles
Source Institutions
This activity has three story puzzles learners can solve to learn about life in the Arctic.
Sea State: Forecast Conditions at Sea
Source Institutions
In this oceanography and data collection activity, learners cast real time sea state conditions using buoys from NOAA's National Data Buoy Center.
Hexagon Hunt
Source Institutions
This activity gets learners looking at 6-sided shapes in nature, including the cells of a beehive, as well as other shapes.
Woodlands Map
Source Institutions
This is a culminating activity which allows learners to summarize what they know about Woodlands Native Americans by creating illustrations and map symbols for a large outline map (see related Activit
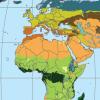
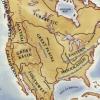
Discovering Rainforest Locations
Source Institutions
In this activity, learners will examine various world data maps to combine the information and predict which areas could be tropical rainforests.
A Scientific Cleanup
Source Institutions
This is a comprehensive lesson plan on page 85 for a group cleanup trip to a local beach, lake or stream. Learners keep track of the types and amounts of trash picked up and analyze this information.

Mapping Sea Level Rise
Source Institutions
In this activity related to climate change, learners create and explore topographical maps as a means of studying sea level rise.
Gravestone Weathering
Source Institutions
In this activity (located on pages 9-14 of PDF), learners visit a cemetery to examine the distinguishing characteristics of rock weathering.
Make a Terrarium
Source Institutions
In this activity, learners make a miniature greenhouse or "terrarium" to explore the greenhouse effect.

A Degrading Experience
Source Institutions
In this activity on page 27, learners perform an experiment to learn about how different types of marine debris degrade and how weather and sunlight affect the rate of degradation.