Search Results
Showing results 201 to 220 of 323
The Carbon Cycle and its Role in Climate Change: Activity 2
Source Institutions
In this activity (on page 7), learners explore the meaning of a "carbon sink." Using simple props, learners and/or an educator demonstrate how plants act as carbon sinks and how greenhouse gases cause
Go with the Flow
Source Institutions
Learners draw comic-style pictures to show the water cycle. From a starting picture, one learner draws what happens to the water in the next panel, then passes the comic strip to another learner.
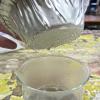
Water "Digs" It!
Source Institutions
In this activity, learners investigate soil erosion. Learners set up a simulation to observe how water can change the land and move nutrients from one place to another.
Waves and Tides
Source Institutions
In this 7-10 day investigation, learners develop an understanding of waves and tides and their motion through discussion, demonstration, and hands-on activities.
A Pressing Engagement
Source Institutions
In this quick and easy activity and/or demonstration, learners illustrate the effect of the weight of air over our heads.

The Daily Ups and Downs
Source Institutions
In this activity, learners graph 48 hourly air temperatures from a local weather observation site and observe the diurnal temperature variations.
Creating a Soil Map
Source Institutions
In this activity, learners investigate soil conditions by creating a soil map. Learners record soil characteristics and compare the conditions of soil in different grid sections.
Launch Altitude Tracker
Source Institutions
In this activity, learners construct hand-held altitude trackers. The device is a sighting tube with a marked water level that permits measurement of the inclination of the tube.
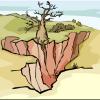
A Hole in the Ground
Source Institutions
Learners build models of sinkholes to gain an intuitive knowledge of their physical aspects.
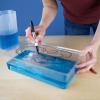
Exploring Earth: Rising Sea
Source Institutions
“Exploring Earth: Rising Sea” is a hands-on activity demonstrating ways to use topographical mapping techniques to track changes in sea level. The activity is connected to current NASA research.
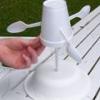
Measuring the Wind
Source Institutions
In this activity, learners explore how anemometers work to record wind speeds and how the equipment has undergone engineering adaptations over time.
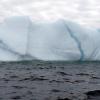
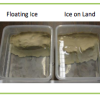
Melting Ice
Source Institutions
In this activity, learners explore density, convection, stratification, and, by inference, the melting of icebergs. Learners make hypotheses, test their hypotheses, and explain their observations.
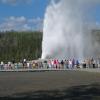
Tiny Geyser Models
Source Institutions
In this activity (located on page 2), learners will construct tiny model geysers out of film canisters, warm water, and antacid seltzer tablets.
Tsunami: Waves of Destruction
Source Institutions
In this activity, learners use tsunami time travel maps to predict how long it will take a tsunami to reach the shore.
Sea Level: On The Rise
Source Institutions
Learners will understand the relationship between climate change and sea-level rise.
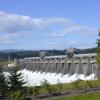
The Best Dam Simulation Ever
Source Institutions
This online simulation game explores the different consequences of water levels on the Columbia River in the Pacific Northwest.
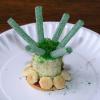
Build a Coral Polyp
Source Institutions
In this activity, learners build one or more edible coral polyps and place them together to form a colony.
Wonderful Weather
Source Institutions
In this activity, learners conduct three experiments to examine temperature, the different stages of the water cycle, and how convection creates wind.
Fossil Age Estimation Model
Source Institutions
In this activity (page 1 of the PDF under SciGirls Activity: Dinosaurs), learners will model how paleontologists estimate the age of fossil discoveries by extracting “fossil” playing cards from newspa

Go with the Flow
Source Institutions
In this quick and easy activity and/or demonstration, learners use two empty soda cans to illustrate Bernoulli's principle.