Search Results
Showing results 1 to 20 of 96

Dripping Wet or Dry as a Bone?
Learners investigate the concept of humidity by using a dry and wet sponge as a model. They determine a model for 100% humidity, a sponge saturated with water.
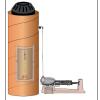
Mercury in the Environment
Source Institutions
In this environmental science lesson, learners will examine the dangers of mercury and how humans contribute to growing mercury emissions on Earth.

A Funny Taste
Source Institutions
In this activity, learners explore the different salinities of various sources of water by taste-testing.

The Rumblin' Road: Determining distance to a Thunderstorm
Source Institutions
In this activity, learners discover how to determine the distance to a lightning strike or nearby thunderstorm.
Hold a Hill
Source Institutions
In this outdoor activity, learners investigate the relationship between the slope of a trail and soil erosion.

Quadraphonic Wind
Source Institutions
In this activity, learners discover how the extent of various wind speeds changes in each of the four quadrants around a hurricane.
Landing the Rover
Source Institutions
In this team design challenge (page 19-24 of PDF), learners "land" a model Lunar Rover in a model Landing Pod (both previously built in activities #3 and #4 in PDF).

A Recipe for Air
Learners use M&Ms® (or any other multi-color, equally-sized small candy or pieces) to create a pie graph that expresses the composition of air.
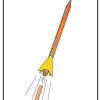
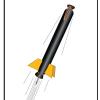
3...2...1 Puff!
Source Institutions
In this activity, learners build small indoor paper rockets, determine their flight stability, and launch them by blowing air through a drinking straw.
Toilet Paper Solar System
Source Institutions
In this activity, learners build a scale model of the solar system using a roll of toilet paper.

Mold Mole Molds
Source Institutions
In this activity, learners make different shapes that hold exactly one mole of gas (air).
Foam Rocket
Source Institutions
In this activity, learners work in teams build and launch rubberband-powered foam rockets.
Measuring and Protecting Skin
Source Institutions
In this activity, learners compare and contrast their own skin (including the area covered) with that of an orange.
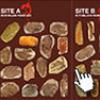
Prehistoric Climate Change
Source Institutions
In this online interactive, learners use fossils to infer temperatures 55 million years ago, at the sites where the fossils were found.
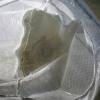
Collect Invertebrates to Determine Water Quality
Source Institutions
This activity (located on page 3 of the PDF under GPS: Alligator Habitat Activity) is a full inquiry investigation into organisms and the health of their ecosystems.
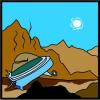
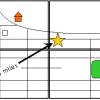
Chances Are: OH NO! Look Out Below for a UFO
Source Institutions
In this math lesson (on Page 13), learners predict and simulate the likelihood of an event occurring.
Rocket Wind Tunnel
Source Institutions
In this activity, learners evaluate the potential performance of air rockets placed inside a wind tunnel.
Solar System in My Neighborhood
Source Institutions
In this activity, learners shrink the scale of the vast solar system to the size of their neighborhood.
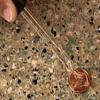
Penny Drop
Source Institutions
In this quick activity about the properties of water (page 1 of PDF under SciGirls Activity: Malformed Frogs), learners will use an eyedropper to slowly place one drop of water at a time onto a penny,

Earth Atmosphere Composition
Source Institutions
In this activity, learners use rice grains to model the composition of the atmosphere of the Earth today and in 1880. Learners assemble the model while measuring percentages.