Search Results
Showing results 41 to 51 of 51
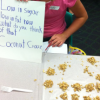
Science Cooks!
Source Institutions
In this health, cooking, and math activity, learners explore nutrition and examine nutrition labels.
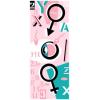
Genetics the Easy Way
Source Institutions
In this activity, learners make critters out of recyclables and apply the rules of mathematics to solve genetics problems.
Giant Museum: Create a Scale Model
Source Institutions
In this activity, learners will predict the size of a giant scale model of a comb or other rectangular object, then make one. If you tripled the size of a dollar bill, could you sit on it?
Double or More
Source Institutions
Choose a recipe to double (or triple, quadruple, or halve). Show everyone the recipe and engage them in figuring out: How much will we need to increase the recipe to feed everyone?

Number Sense and Computation: An Apple a Day
Source Institutions
In this math lesson, learners make estimates to analyze the number of apples per acre, and visualize the magnitude of one million.
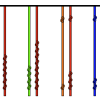
Quipus
Source Institutions
Learners create an Incan counting device called a quipu (pronounced kee-poo).
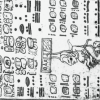
Breaking the Code: Mayan Math
Source Institutions
This is a lesson plan for an activity in which learners, playing the role of archeologists, use math concepts about number bases to decipher the Dresden Codex, an ancient Mayan document.
Construction and Destruction
Source Institutions
In this three/four-day lesson, learners calculate perimeters and areas and draw the castle plan to scale.
Look Around: Hunt For Sizes, Shapes and Numbers
Source Institutions
In this activity, learners will participate in a scavenger hunt involving sizes, shapes, and numbers. This activity works well with a whole group, individuals, or families.
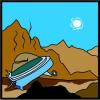
Chances Are: OH NO! Look Out Below for a UFO
Source Institutions
In this math lesson (on Page 13), learners predict and simulate the likelihood of an event occurring.

Arctic Sea Ice
Source Institutions
In this activity, learners explore how the area of Arctic sea ice has changed over recent years. First, learners graph the area of Arctic sea ice over time from 1979 to 2007.