Search Results
Showing results 1 to 20 of 67
Serving Sizes
Source Institutions
In this nutrition and estimation activity (page 12 of PDF), learners estimate serving sizes of different foods and compare their estimates to serving size information provided on nutrition food labels
Food Grab
Source Institutions
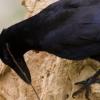
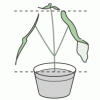
In this outdoor activity, learners design devices that will catch prey or gather plants.
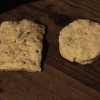
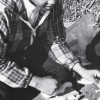
Maritime Munchies
Source Institutions
In this activity, learners follow simple historical maritime recipes to cook up hardtack and swanky, and then compare the foods they eat to what was served on ships in the past.
Ripening of Fruits and Vegetables
Source Institutions
In this activity, learners test the rate of ripening fruit and vegetables and use a chemical to inhibit the ripening process.
Grabbing a Bite to Eat
Source Institutions
In this activity, learners perform an experiment that replicates the dilemma faced by birds in acquiring food from a confined area.

Nutritional Challenges
Source Institutions
In this nutrition activity (page 26 of PDF), learners consider the nutritional needs of people with specific dietary requirements, such as athletes, persons with diabetes and vegetarians, and create a
Biotechnology Through Time
Source Institutions
In this activity, learners investigate the history and development of agricultural biotechnology.

Sustainable Grazing
Source Institutions
In this activity, learners investigate the food, water, and space needs of common livestock animals.
The Menu Game at the Terribly Terrific Taco
Source Institutions
In this math game (Page 15 of the Dining Out! PDF), learners figure discounts and/or profit increases for various food totals. Learners add decimals to $100.
The Jelly Bean Problem (JBP)
Source Institutions
In this activity, learners are challenged to eat some candy as a cell would need to as well as to think about some of the problems that arise when a cell ingests food.
Number Sense and Computation: Food For Thought
Source Institutions
In this math lesson, learners identify and compare unit costs of given items. Learners use computation skills, problem solving and number sense to find the cost of an ounce of cereal.
Servings and Choices
Source Institutions
In this nutrition activity (page 16 of PDF), learners document their individual eating habits and learn whether their eating patterns meet their needs.
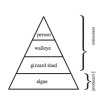
Who Can Harvest a Walleye?
Source Institutions
This activity focuses on interactions within Earth systems and the effects of human activities. In this activity learners build a biomass pyramid.
Do Plants Need Light?
Source Institutions
In this food science activity, learners conduct an experiment that demonstrates the importance of light to plants.
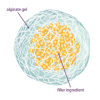
Self-Assembling Dessert Toppings
Source Institutions
This is an activity (located on page 3 of the PDF under Self-Assembly Activity) about self-assembly, the ability of molecules to assemble themselves according to certain rules.
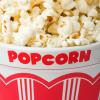
Buckets of Popcorn
Source Institutions
In this activity, learners develop an understanding of cylinders and volume as they compare two sizes of popcorn buckets.
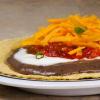
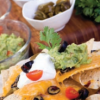
Creating Tostadas
Source Institutions
In this activity, learners develop their understanding of combinations as they create as many different kinds of tostadas as possible.
Your Energy Needs
Source Institutions
In this activity about the relationship between food and energy (page 8 of PDF), learners estimate average daily baseline energy (Calorie) needs and energy needs for different levels of activity.

Create a Pasta Population Map
Source Institutions
Learners work as a group to create a map of their community. They use pasta to represent people, and glue the pasta on their maps to show areas of large population.
Number Sense and Computation: To Half or Half Not
Source Institutions
In this math lesson, learners use slices of bread and geoboards to explore several ways to divide a rectangle in half. Learners also identify equivalent fractions that represent one-half.