Search Results
Showing results 1 to 6 of 6

Exponential Models: Rhinos and M&M’s ®
Source Institutions
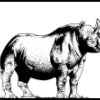
In this math lesson, learners model exponential decay and exponential growth using M&M's, paper folding, and African rhino population data.

Statistics: Steppin' Out
Source Institutions
In this math lesson, learners construct box-and-whisker plots to analyze and compare data sets. Learners investigate whether or not long-legged people run faster than short-legged people.

Tree-mendous Plots
Source Institutions
In this math lesson, learners record and graph plant growth and interpret data. Learners plant seeds, and once the seeds sprout, record the change in height of the plants for several days.

Bean Bugs
Source Institutions
In this outdoor biology and math activity, learners estimate the size of a population of organisms too numerous to count.

Statistics: Something Fishy
Source Institutions
In this math lesson, learners apply the concepts of ratio and proportion to the capture-recapture statistical procedure.

Sustainable Grazing
Source Institutions
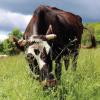
In this activity, learners investigate the food, water, and space needs of common livestock animals.
