Search Results
Showing results 81 to 100 of 180
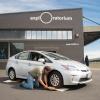
Tired Weight
Source Institutions
Yes, you can weigh your car by figuring out your wheel's tire pressure combined with the "tire's footprint." You'll need someone with a car, driver's license, and safety in mind.
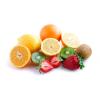
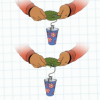
Pennies for Pits
Source Institutions
In this math lesson, learners use fruit to learn about proportions and percentages. Learners compare the weights of the edible and non-edible portions of fruit.
Balance Challenge
Source Institutions
In this quick activity, learners take a balance challenge to measure their average balance time. As they collect data, they investigate how practice and repetition improve their balance time.
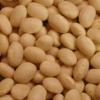
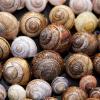
A Swell Activity with Beans
Source Institutions
In this combination chemistry and physics activity, learners explore water absorption in dried beans or peas and learn how this affects their physical properties.
Measuring Your Blind Spot
Source Institutions
In this activity, learners calculate the width (horizontal diameter) of the blind spot on their retina. Learners make a blind spot tester using a piece of notebook paper.
Heavy or Light
Source Institutions
In this activity, learners explore a scale by comparing objects, which look similar but have different weights. Learners predict and then measure the weights of various objects using a scale.

It's the "Rain," Man
Source Institutions
In this weather forecasting activity, learners use common materials to construct a rain gauge and measure daily, monthly, and yearly rainfall.
Breaking Point
Source Institutions
In this activity, learners build penetrometers to test leaf toughness. Biologists measure leaf toughness to study the feeding preferences of insects and bugs.
Measuring Biodiversity
Source Institutions
Learners use a variety of beans to represent a variety of species, and scatter these beans over a large piece of paper representing the environment.
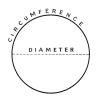
Pi Graph
Source Institutions
In this activity, learners use a straight line to learn about circles. Learners measure and record the diameter and circumference of different sized cylindrical objects on a chart.
Glaciers
Source Institutions
In this online activity, learners adjust mountain snowfall and temperature to see how glaciers grow and shrink. They will use scientific tools to measure thickness, velocity and glacial budget.
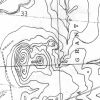
Blazing the Trail
Source Institutions
In this math lesson, learners estimate distances between landmarks and use a map and scales to determine the actual distances.
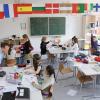
Mapping the Classroom
Source Institutions
In this activity, learners discover the importance of maps and scale as they work together to create a map of the classroom.
Meteoroids and the Craters They Make
Source Institutions
In this activity, learners investigate the formation of craters. Learners will examine how the size, angle and speed of a meteorite's impact affects the properties of craters.

Mold Growth
Source Institutions
In this activity learners observe mold growth on different types of bread by measuring and recording the growth rate.
Motor Learning
Source Institutions
In this activity (26th on the page), learners construct an easy-to-build device and test motor learning.

Pulse of Life: Measure Your Pulse
Source Institutions
In this activity, learners take their own pulse and explore how heart rate is affected by various activities.

Percentage of Oxygen in the Air
Source Institutions
In this activity, learners calculate the percentage of oxygen in the atmosphere by using steel wool's ability to rust.
Heart to Heart
Source Institutions
In this activity, learners compare ways to measure their heart rates. Learners build their own stethoscopes and learn how exercise affects heart rate.