Search Results
Showing results 1 to 11 of 11

Heat Capacity: Can't Take the Heat?
Source Institutions
Why is ocean water sometimes the warmest when the average daily air temperature starts to drop? In this activity, learners explore the differing heat capacities of water and air using real data.
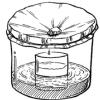
Rain Machine (Solar Still)
Source Institutions
In this activity, learners work in groups to build simple solar stills filled with salt water. After the stills are complete, learners observe what happens when they place the stills in the sun.
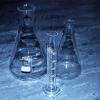
Rates of Change: Bottles and Divers
Source Institutions
In this math lesson (page 2 of the PDF), learners use bottles of various shapes to explore the abstract concept of rate of change.
Patterns and Functions: Fill 'er Up
Source Institutions
In this math lesson, learners predict, interpret, and sketch graphs of functions related to the shapes of bottles. A measure of water is poured into a container.
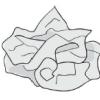
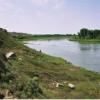
Crumple a Watershed
Source Institutions
Learners gain an intuitive knowledge of the physical aspects of watersheds by creating their own watershed models.
Build A Hydrometer
Source Institutions
In this activity, learners will explore how a hydrometer works by building a working model and conducting experiments.
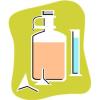
Weighty Questions
Source Institutions
In this activity about humans and space travel (page 1 of PDF), learners compare and contrast the behavior of a water-filled plastic bag, both outside and inside of a container of water.
Drip, Drop, Drip, Drop
Source Institutions
In this math lesson, learners design an experiment to model a leaky faucet and determine the amount of water wasted due to the leak.
Mystery of the Disappearing Cottonwoods
Source Institutions
Learners will explore the scientific mystery behind a disappearing group of trees by examining data and attempting to explain the decline.
Why Circulate?
Source Institutions
In this activity related to the human circulatory system (on page 10 of the PDF), learners observe the dispersion of a drop of food coloring in water, draw conclusions about the movement of dissolved
Statistics: Wet Heads
Source Institutions
In this math lesson, learners learn how to construct stem and leaf plots. Learners first estimate the number of drops of water that will fit on the head of a penny.