Search Results
Showing results 1 to 11 of 11
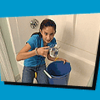
Shower Estimation
Source Institutions
In this activity, learners calculate their water usage (in cups and galloons) during an average shower. Learners also chart and analyze water usage during showers in their households.
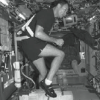
Challenge: Microgravity
Source Institutions
In this activity about the circulatory system and space travel (on page 38 of the PDF), learners use water balloons to simulate the effects of gravity and microgravity on fluid distribution in the bod

A Hurricane's Storm Surge Affects our Estuaries
Source Institutions
In this activity, learners construct a coastal landmass from sand and add features such as tidal creeks and barrier islands.
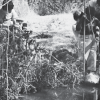
Crawdad Grab
Source Institutions
In this outdoor, freshwater activity, learners explore the behavior and food preferences of crawdads (or crabs) by "fishing" for them with various baits.
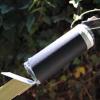
Periscope
Source Institutions
In this activity, learners construct a device that allows them to look over ledges or around corners.
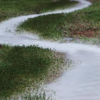
Stream Table
Source Institutions
In this activity, learners use aluminum trays and wooden blocks to form stream tables to investigate river formations in two different landscape scenarios.
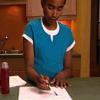
Invisible Ink
Source Institutions
In this simple chemistry activity (page 1 of PDF under SciGirls Activity: Colorblind Dogs) about acids and bases, learners will mix a baking soda and water solution and use it to paint a message on a
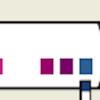
Urine the Know
Source Institutions
In this activity on page 5 of the PDF, learners compare water with artificial urine to see how urinalysis works. Learners use urinalysis test strips to test for glucose and protein in the fake urine.
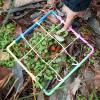
Counting With Quadrants
Source Institutions
Millions of organisms can live in and around a body of water.

Avogadro's Bubbly Adventure
Source Institutions
In this activity on page 7 of the PDF, learners investigate the solubility of gas in water at different temperatures. This experiment will help learners determine if temperature affects solubility.

Arctic Sea Ice
Source Institutions
In this activity, learners explore how the area of Arctic sea ice has changed over recent years. First, learners graph the area of Arctic sea ice over time from 1979 to 2007.