Search Results
Showing results 1 to 18 of 18

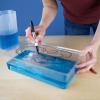
Heat Capacity: Can't Take the Heat?
Source Institutions
Why is ocean water sometimes the warmest when the average daily air temperature starts to drop? In this activity, learners explore the differing heat capacities of water and air using real data.
Make a Water Cycle Wristband
Source Institutions
In this activity, learners thread colored beads onto string. Each beach represent a process of the water cycle.
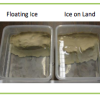
Causes and Effects of Melting Ice
Source Institutions
In this activity, learners explore the concept of density-driven currents (thermohaline circulation) and how these currents are affected by climate change.
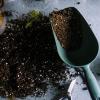
Super Soaker
Source Institutions
In this activity (page 1 of the PDF under SciGirls Activity: Bogs), learners will test cups full of potting soil, sand, and sphagnum moss to see which earth material is able to soak up the most water.
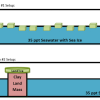
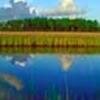
Nutrients in an Estuary
Source Institutions
In this activity, learners model estuaries, artificially enriching both fresh and salt water samples with different amounts of nutrients and observing the growth of algae over several weeks.

Shake and Break
Source Institutions
In this activity, learners will model the mechanical weathering and erosion of rocks in a stream or river.
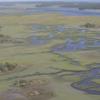
Human Impact on Estuaries: A Terrible Spill in Grand Bay
Source Institutions
In this activity, learners make a model of a pollution spill that occurred at Bangs Lake in Mississippi and measure water quality parameters in their model.
Solving Dissolving
Source Institutions
The Sacred Cenote at Chichén Itzá is a sink hole, or well, containing groundwater. In this activity, learners create their own cenote using chalk, limestone, acids, and rain water.
Weathering and Erosion
Source Institutions
In this activity (page 13 of the PDF), learners discover how weathering and erosion change the Earth’s surface.

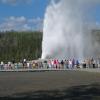
Geyser
Source Institutions
This Exploratorium activity can be used in many contexts because geysers are great opportunities for learning about heat and temperature changes as well as geological/space science phenomena.
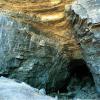
Soda Pop Cave
Source Institutions
In this geology activity (page 6 of the PDF), learners explore how carbonic acid can slowly dissolve limestone and form caves.
Exploring Earth: Rising Sea
Source Institutions
“Exploring Earth: Rising Sea” is a hands-on activity demonstrating ways to use topographical mapping techniques to track changes in sea level. The activity is connected to current NASA research.
Tiny Geyser Models
Source Institutions
In this activity (located on page 2), learners will construct tiny model geysers out of film canisters, warm water, and antacid seltzer tablets.
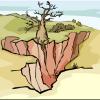
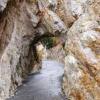
A Hole in the Ground
Source Institutions
Learners build models of sinkholes to gain an intuitive knowledge of their physical aspects.
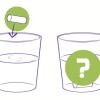
Cave in a Cup
Source Institutions
In this activity (page 2 of PDF under GPS: Cave Swallows Activity), learners will model how caves are formed by placing one piece of chalk in a cup of vinegar and another piece in a cup of water, then
Sea Level: On The Rise
Source Institutions
Learners will understand the relationship between climate change and sea-level rise.

Mapping Sea Level Rise
Source Institutions
In this activity related to climate change, learners create and explore topographical maps as a means of studying sea level rise.
Waves and Tides
Source Institutions
In this 7-10 day investigation, learners develop an understanding of waves and tides and their motion through discussion, demonstration, and hands-on activities.