Search Results
Showing results 61 to 80 of 85
Breathing Yeasties
Source Institutions
In this life science activity (page 8 of the PDF), learners explore the carbon cycle by mixing yeast, sugar and water.
Mystery of the Disappearing Cottonwoods
Source Institutions
Learners will explore the scientific mystery behind a disappearing group of trees by examining data and attempting to explain the decline.
Why Circulate?
Source Institutions
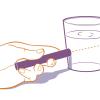
In this activity related to the human circulatory system (on page 10 of the PDF), learners observe the dispersion of a drop of food coloring in water, draw conclusions about the movement of dissolved
Malformed Frogs
Source Institutions
This activity (on page 2 of the PDF under SciGirls Activity: Malformed Frogs) is a full inquiry investigation into using indicator species to assess the health of an environment.
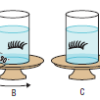
Visualizing How the Vestibular System Works
Source Institutions
In this activity (page 59 of the PDF), learners spin and observe false eyelashes in jars of water (prepared at least 1 day ahead of time) to investigate the effects of different types of motion on the
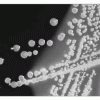
Microbes are Everywhere
Source Institutions
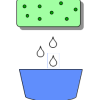
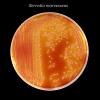
In this four-day activity, learners grow bacteria and/or fungi from a variety of locations and compare the results.

It's a Gas, Man
Source Institutions
In this activity, learners discover if carbon dioxide has an effect on temperature.
Space Stations: Sponge Spool Spine
Source Institutions
In this activity, learners simulate what happens to a human spine in space by making Sponge Spool Spines (alternating sponge pieces and spools threaded on a pipe cleaner).

Monitoring Amphibians
Source Institutions
In this field study, learners discover how to collect data in the field and how their efforts can help certain animals, specifically, amphibians.
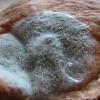
Moldy Jell-O
Source Institutions
In this laboratory activity, learners design an experiment to evaluate how environmental factors influence the growth of molds.
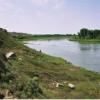
The Blue Crab's Chesapeake Journey
Source Institutions
In this data collection activity about crabs, learners use data from the Virginia Institute of Marine Science (VIMS) trawl survey to determine the areas of the Chesapeake Bay that are being used by bl

Avogadro's Bubbly Adventure
Source Institutions
In this activity on page 7 of the PDF, learners investigate the solubility of gas in water at different temperatures. This experiment will help learners determine if temperature affects solubility.
Trees: Buds and Twigs
Source Institutions
In this hands-on nature activity, learners observe the emergence of leaves and flowers. Branches from trees and bushes are collected in the early spring, brought indoors, and placed in water.

Sustainable Grazing
Source Institutions
In this activity, learners investigate the food, water, and space needs of common livestock animals.
Beam Me Up!
Source Institutions
This is a quick activity (on page 2 of the PDF under Stained Glass Activity) about the "Tyndall effect," the scattering of visible light when it hits very small dispersed particles.
Measurement: It Takes Ten
Source Institutions
In this math lesson, learners practice estimation and measurement skills as they move from station to station calculating length, volume, weight, and area.
Fish Eyes: More than Meets the Eye
Source Institutions
In this data collection and analysis activity, learners evaluate fish physiology and ecology using vision research data from Dr.

Arctic Sea Ice
Source Institutions
In this activity, learners explore how the area of Arctic sea ice has changed over recent years. First, learners graph the area of Arctic sea ice over time from 1979 to 2007.
Demonstrating An Epidemic
Source Institutions
This experiment allows learners to experience a small scale "epidemic," demonstrating the ease with which disease organisms are spread, and enables learners to determine the originator of the "epidemi

Patterns and Relationships: Here, There & Everywhere
Source Institutions
In this math activity, learners use a variety of sensory modalities to gain experiences with identifying, describing and creating repeating patterns.