Search Results
Showing results 21 to 40 of 44
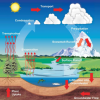
The Crayon Rock Cycle
Source Institutions
In this activity, learners use crayons to draw conclusions about rocks and the rock cycle.
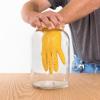
Weather Stations: Phase Change
Source Institutions
In this activity, learners observe the water cycle in action! Water vapor in a tumbler condenses on chilled aluminum foil — producing the liquid form of water familiar to us as rain and dew.

It's the "Rain," Man
Source Institutions
In this weather forecasting activity, learners use common materials to construct a rain gauge and measure daily, monthly, and yearly rainfall.

How Much Water is in that Cloud?
Source Institutions
In this activity, learners working in pairs saturate a cotton ball using water drops from an eyedropper to demonstrate the high water capacity of clouds.
Fog Chamber
Source Institutions
In this weather-related activity, learners make a portable cloud in a bottle.

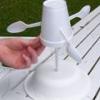
Twirling in the Breeze
Source Institutions
In this engineering activity, learners build a device (an anemometer) to measure how fast the wind is blowing.
AM in the PM
Source Institutions
In this activity, learners will listen to as many radio stations as possible to discover that AM radio signals can travel many hundreds of miles at night.
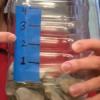
Homemade Rain Gauge
Source Institutions
In this activity, learners will build rainwater collectors to practice meteorology in their own backyard. Collect and analyze data to determine how much rainfall you get in a set period of time.
Running in Circles
Source Institutions
In this group activity, learners use some common objects and work together to simulate the Coriolis effect. During the challenge, learners make predictions and test different scenarios.
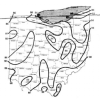
Creating a Soil Map
Source Institutions
In this activity, learners investigate soil conditions by creating a soil map. Learners record soil characteristics and compare the conditions of soil in different grid sections.
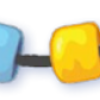
Make a Water Cycle Wristband
Source Institutions
In this activity, learners thread colored beads onto string. Each beach represent a process of the water cycle.

A Hurricane's Storm Surge Affects our Estuaries
Source Institutions
In this activity, learners construct a coastal landmass from sand and add features such as tidal creeks and barrier islands.
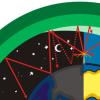
Stargazing
Source Institutions
In this nighttime, outdoor activity, learners keep a record of what they see in the sky by drawing constellations, the Moon, and making note of the weather and conditions each day.
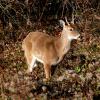
Population Study Game: Oh, Deer!
Source Institutions
In this activity, learners model a population of deer and see how the number of deer changes over time.
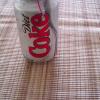
Diet Light
Source Institutions
In this quick activity, learners observe how the added sugar in a can of soda affects its density and thus, its ability to float in water.
Erosion
Source Institutions
In this activity, learners model erosion using a clear shoebox and sand or soil.
How is Coastal Temperature Influenced by the Great Lakes and the Ocean?
Source Institutions
In this two-part lesson, learners discover how large bodies of water can serve as a heat source or sink at different times and how proximity to water moderates climate along the coast.
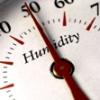
Making Sense of Sensors
Source Institutions
In this activity, learners explore sensors and focus specifically on how to measure humidity using a sensor.
The Return of El Nino
Source Institutions
In this activity related to climate change and data analysis, learners examine temperature and precipitation data to determine if climate variations are due to El Niño.
Measuring the Wind
Source Institutions
In this activity, learners explore how anemometers work to record wind speeds and how the equipment has undergone engineering adaptations over time.