Search Results
Showing results 1 to 19 of 19
Glaciers
Source Institutions
In this online activity, learners adjust mountain snowfall and temperature to see how glaciers grow and shrink. They will use scientific tools to measure thickness, velocity and glacial budget.
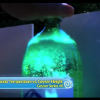
Illuminations on Rates of Reactions
Source Institutions
In this activity, learners investigate the speed of chemical reactions with light sticks. Learners discover that reactions can be sped up or slowed down due to temperature changes.

Get the Porridge Just Right
Source Institutions
Learners set up three different bowls, each with a different mass of oatmeal. Learners monitor the temperature of the oatmeal and find that larger masses take longer to cool.
Light on Other Planets
Source Institutions
In this math-based activity, learners model the intensity of light at various distances from a light source, and understand how astronomers measure the amount of sunlight that hits our planet and othe
Make a Terrarium
Source Institutions
In this activity, learners make a miniature greenhouse or "terrarium" to explore the greenhouse effect.
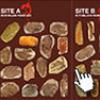
Prehistoric Climate Change
Source Institutions
In this online interactive, learners use fossils to infer temperatures 55 million years ago, at the sites where the fossils were found.
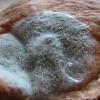
Moldy Jell-O
Source Institutions
In this laboratory activity, learners design an experiment to evaluate how environmental factors influence the growth of molds.
Temperature vs. Height: Soda Geyser Series #6
Source Institutions
In this activity, learners conduct a controlled experiment to examine how temperature will affect the height of a soda geyser.

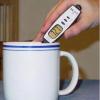
Temperature Tactics
Source Institutions
In this activity, learners explore the devices used over time to measure changes in temperature.
What's the Angle?
Source Institutions
This activity helps learners understand how the angle of the Sun affects temperatures around the globe.
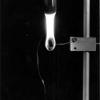
Burn a Peanut
Source Institutions
In this activity, learners burn a peanut, which produces a flame that can be used to boil away water and count the calories contained in the peanut.
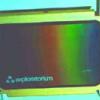
Liquid Crystal Thermometers
Source Institutions
In this activity, learners explore liquid crystal thermometers to observe how heat flows by conduction, convection, radiation, and evaporation.

Terrestrial Hi-Lo Hunt
Source Institutions
In this outdoor activity, learners search for the warmest and coolest, windiest and calmest, wettest and driest, and brightest and darkest spots in an area.
Planet Surfing
Source Institutions
In this astronomy activity (page 6 of the PDF), learners will compare and contrast two planets in the solar system using data obtained from the internet.

Drawing Conclusions
Source Institutions
In this weather forecasting activity, learners determine the location of cold and warm fronts on weather plot maps.
Taking Its Temperature
Source Institutions
In this activity (pages 5-7), learners investigate the properties of smart materials, which are materials that respond to things that happen around them.

Heat Capacity: Can't Take the Heat?
Source Institutions
Why is ocean water sometimes the warmest when the average daily air temperature starts to drop? In this activity, learners explore the differing heat capacities of water and air using real data.
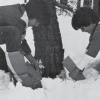
Wintergreen
Source Institutions
In this outdoor, winter activity, learners find living green plants under the snow and determine the light and temperature conditions around the plants.
Keep it Cool
Source Institutions
In this activity, learners explore how engineers have met the challenge of keeping foods, liquids, and other items cool.