Search Results
Showing results 1 to 20 of 36
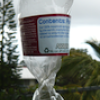
Chemical Footprint—Family Activity
Source Institutions
In this multi-part activity learners examine non-point water pollution.

Quadraphonic Wind
Source Institutions
In this activity, learners discover how the extent of various wind speeds changes in each of the four quadrants around a hurricane.

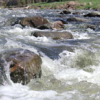
A Cubic Foot Per Second
Source Institutions
In this activity, learners measure and calculate the amount of cubic feet various containers contain. Next, learners investigate cubic feet per second (cps), by carrying jugs in one second.

Whose Fault Is It?
Source Institutions
In this seismic simulation, learners play a "who-dunnit" game to explore earthquakes.
Let's Count Humpback Whales: Environmental Effects on Population
Source Institutions
In this activity, learners use whale count data from the Hawaiian Islands Humpback Whale National Marine Sanctuary to compare whale counts in relation to environmental factors.
Fish Communities: National Marine Sanctuaries
Source Institutions
In this data activity, learners will compare and contrast fish communities, diversity and habitats in U.S. National Marine Sanctuaries.
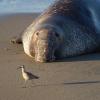
Natural Selection in Protected and Unprotected Populations
Source Institutions
In this simulation, learners model two elephant seal populations and how they change over time. Learners start with cards representing a variety of seals.
Crunch Time
Source Institutions
In this quick and easy activity and/or demonstration, learners use two empty 2-liter bottles and hot tap water to illustrate the effect of heat on pressure.
Catch & Release II: It's Catching On!
Source Institutions
Throw that fish back? A new generation of ethical anglers concerned about conserving resources is participating in "catch and release" fishing. How is this going?
Mapping Mockingbirds
Source Institutions
This lesson plan revolves around studying the speciation of the Galápagos mockingbirds, which are on display at the California Academy of Sciences.
For the Birds: Environmental Effects on Population
Source Institutions
In this activity, learners will investigate how shorebirds and seabirds are extremely vulnerable to changes in their environment, whether human-induced or otherwise.
A Pressing Engagement
Source Institutions
In this quick and easy activity and/or demonstration, learners illustrate the effect of the weight of air over our heads.
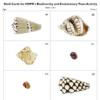
Biodiversity and Evolutionary Trees
Source Institutions
In this interactive activity, learners analyze seashells to explore phylogeny and evolution. Learners identify similar and dissimilar seashells to create a phylogenetic tree.

Coral Snapshots: Biodiversity in Marine Protected Areas
Source Institutions
In this data activity, learners analyze data from coral reef snapshots taken by scientists at the Virginia Institute of Marine Science.

Go with the Flow
Source Institutions
In this quick and easy activity and/or demonstration, learners use two empty soda cans to illustrate Bernoulli's principle.
Fish Eyes: More than Meets the Eye
Source Institutions
In this data collection and analysis activity, learners evaluate fish physiology and ecology using vision research data from Dr.
Haunted by Hurricanes: Use Data to Learn About Hurricanes
Source Institutions
In this activity, learners will determine if the frequency and intensity of hurricanes are changing using real data from the National Hurricane Center.
The Return of El Nino
Source Institutions
In this activity related to climate change and data analysis, learners examine temperature and precipitation data to determine if climate variations are due to El Niño.
The Carbon Cycle: How It Works
Source Institutions
In this game, learners walk through an imaginary Carbon Cycle and explore the ways in which carbon is stored in reservoirs and the processes that transport the carbon atom from one location to another
Diatom Ooze: Ooze Clues
Source Institutions
In this activity, learners will plot the distribution of various oozes using information from sediment maps.