Search Results
Showing results 1 to 17 of 17
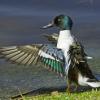
For the Birds: Environmental Effects on Population
Source Institutions
In this activity, learners will investigate how shorebirds and seabirds are extremely vulnerable to changes in their environment, whether human-induced or otherwise.

Energy Use in the Americas
Source Institutions
Learners explore the relationship between energy consumption, population, and carbon emissions in the countries of the Americas.
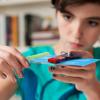
Detect Solar Storms
Source Institutions
In this activity, learners build their own magnetometer using an empty soda bottle, magnets, laser pointer, and household objects.

Heat Capacity: Can't Take the Heat?
Source Institutions
Why is ocean water sometimes the warmest when the average daily air temperature starts to drop? In this activity, learners explore the differing heat capacities of water and air using real data.
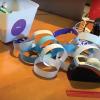
Paper Chain Testing
Source Institutions
Learners will do an experiment to determine which type of paper is strongest while focusing on variables and collecting data.
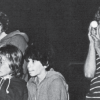
Night Eyes
Source Institutions
In this outdoor, night-time activity, learners discover how to spot eye-shine (reflection of light from an animal's eyes) by using a flashlight to play a simulation game.
Without An Ark: The Effects of Storms and Floods
Source Institutions
April showers bring May flowers, but what do coastal storms bring?

Find My Card
Source Institutions
In this activity, learners find the answer to the question, "if you have a pile of 8 cards, and you remove half, then half again, how many times can you do this until you get to just one card?" This w
Let's Count Humpback Whales: Environmental Effects on Population
Source Institutions
In this activity, learners use whale count data from the Hawaiian Islands Humpback Whale National Marine Sanctuary to compare whale counts in relation to environmental factors.
Coastal Erosion: Where's the Beach?
Source Institutions
Learners use beach profile data from a local beach or online data from Ocean City, Maryland to investigate coastal erosion and sediment transport.
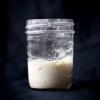
Wild Sourdough
Source Institutions
In this activity, learners explore chemistry and the microbial world by making their own sourdough starter and bread at home using only flour and water.
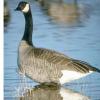
Canada Goose: Explore Trends With Data
Source Institutions
In this activity, learners will explore trends in Canada goose populations using real data from the National Audubon Society's Christmas Bird Count.
Catch & Release II: It's Catching On!
Source Institutions
Throw that fish back? A new generation of ethical anglers concerned about conserving resources is participating in "catch and release" fishing. How is this going?
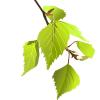
Exercise in Creating Drawings for Field Notebooks
Source Institutions
Learners draw and describe a leaf, and then re-find leaves drawn and described by other learners. Learners can observe leaves outside, or leaves may be brought into the classroom.
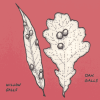
Swell Homes
Source Institutions
In this outdoor activity, learners find the swollen bumps known as "galls" on various plants and get a closeup look at the parasitic animals living inside.
Harmful Algal Blooms: In Full Bloom
Source Institutions
In this activity, learners will investigate the impacts of harmful phytoplankton using NOAA's Coastal Services Center Harmful Algal Bloom Forecasting (HABF) Project data.
Scientific Measurement Exercise
Source Institutions
Learners measure irregularly shaped bones using a variety of measurement methods and tools. Then, they measure again using standard conventions and metric tape measures.