Search Results
Showing results 61 to 80 of 290
Catch & Release II: It's Catching On!
Source Institutions
Throw that fish back? A new generation of ethical anglers concerned about conserving resources is participating in "catch and release" fishing. How is this going?
Sea State: Forecast Conditions at Sea
Source Institutions
In this oceanography and data collection activity, learners cast real time sea state conditions using buoys from NOAA's National Data Buoy Center.

Percentage of Oxygen in the Air
Source Institutions
In this activity, learners calculate the percentage of oxygen in the atmosphere by using steel wool's ability to rust.

Measure the Pressure: The "Wet" Barometer
Source Institutions
In this activity, learners use simple items to construct a device for indicating air pressure changes.
Colors, Colors?
Source Institutions
In this activity related to the famous "Stroop Effect," learners explore how words influence what we see and how the brain handles "mixed messages." Learners read colored words and are asked to say th

Shake it up with Seismographs!
Source Institutions
In this activity, learners explore the engineering behind seismographs and how technology has improved accurate recording of earthquakes.
Measuring Biodiversity
Source Institutions
Learners use a variety of beans to represent a variety of species, and scatter these beans over a large piece of paper representing the environment.

Can I Get Some Pi?
Source Institutions
In this activity, learners will explore pi and the mathematical relationships between a circle's diameter, circumference, and radius.
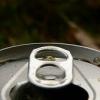
Having a Gas with Cola
Source Institutions
In this activity, learners measure the amount of carbon dioxide in a carbonated drink.
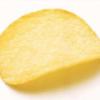
Ship the Chip
Source Institutions
In this activity, learners explore engineering package designs that meet the needs of safely shipping a product.
Super Gelatin
Source Institutions
Can gelatin (like Jell-O ®) change the speed of light?
Pi Graph
Source Institutions
In this activity, learners use a straight line to learn about circles. Learners measure and record the diameter and circumference of different sized cylindrical objects on a chart.
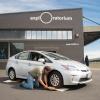
Tired Weight
Source Institutions
Yes, you can weigh your car by figuring out your wheel's tire pressure combined with the "tire's footprint." You'll need someone with a car, driver's license, and safety in mind.
Throwing Pi
Source Institutions
In this calculus activity, learners use a classic problem of geometrical probability to find an important mathematical constant (pi).
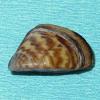
Mussel Your Way Through Photosynthesis
Source Institutions
Using zebra mussels (Dreissena polymorpha), elodea and an indicator dye, learners study the role of light in photosynthesis.
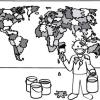
The Poor Cartographer: Graph Coloring
Source Institutions
In this activity, learners help a poor cartographer color in the countries on a map, making sure each country is colored a different color than any of its neighbors.
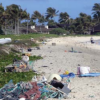
A Scientific Cleanup
Source Institutions
This is a comprehensive lesson plan on page 85 for a group cleanup trip to a local beach, lake or stream. Learners keep track of the types and amounts of trash picked up and analyze this information.
Understanding Albedo
Source Institutions
In this activity related to climate change, learners examine albedo and the ice albedo feedback effect as it relates to snow, ice, and the likely results of reduced snow and ice cover on global temper
Altered Reality
Source Institutions
In this activity, learners discover that the human brain is highly adaptable. Learners try to toss beanbags at a target while wearing prism goggles.

Mapping Sea Level Rise
Source Institutions
In this activity related to climate change, learners create and explore topographical maps as a means of studying sea level rise.