Search Results
Showing results 81 to 100 of 123

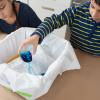
Measure the Pressure II: The "Dry" Barometer
Source Institutions
In this activity, learners use simple items to construct a device for indicating air pressure changes.
The Carbon Cycle: Carbon Tracker
Source Institutions
In this activity, learners play NOAA's Carbon Tracker game and discover ways to keep track of carbon dioxide and other greenhouse gases in the world.
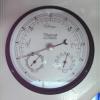
Make Your Own Barometer
Source Institutions
In this weather activity (page 10 of the PDF), learners will demonstrate the changes in atmospheric pressure by constructing their own barometer.
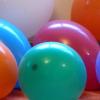
Heavy Air
Source Institutions
In this activity and/or demonstration, learners illustrate visually and physically that air has weight. Learners balance two equally-inflated balloons hanging from string on a yard stick.
Atmosphere Composition Model
Source Institutions
In this activity, learners create a model using metric measuring tapes and atmosphere composition data.
Terrestrial Hi-Lo Hunt
Source Institutions
In this outdoor activity, learners search for the warmest and coolest, windiest and calmest, wettest and driest, and brightest and darkest spots in an area.
Trees: Recorders of Climate Change
Source Institutions
In this activity, learners are introduced to tree rings by examining a cross section of a tree, also known as a “tree cookie.” They discover how tree age can be determined by studying the rings and ho

Drawing Conclusions
Source Institutions
In this weather forecasting activity, learners determine the location of cold and warm fronts on weather plot maps.
Breathing Blue
Source Institutions
In this activity, learners test exhaled breath for carbon dioxide and learn how to use an indicator as a simple way to measure pH.
Moisture Makers
Source Institutions
In this outdoor activity, learners compare the moisture released from different kinds of leaves and from different parts of the same leaf, by observing the color change of cobalt chloride paper.
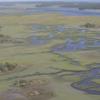
Nutrients in an Estuary
Source Institutions
In this activity, learners model estuaries, artificially enriching both fresh and salt water samples with different amounts of nutrients and observing the growth of algae over several weeks.

Earthquake Energy
Source Institutions
In this geology activity (page 3 of the PDF), learners simulate an earthquake with little more than an elastic band and drinking straws.
Waves: An Alternative Energy Source
Source Institutions
In this data analysis and environmental science activity, learners evaluate the feasibility of wave energy as a practical alternative energy source using ocean observing system (OOS) buoys.

Geyser
Source Institutions
This Exploratorium activity can be used in many contexts because geysers are great opportunities for learning about heat and temperature changes as well as geological/space science phenomena.
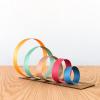
Resonant Rings
Source Institutions
Things that are different sizes and stiffness vibrate differently, and in this Exploratorium Science Snack, you'll see how rings of various diameters react to vibration and external forces.
AM in the PM
Source Institutions
In this activity, learners will listen to as many radio stations as possible to discover that AM radio signals can travel many hundreds of miles at night.
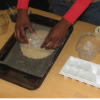
Human Impact on Estuaries: A Terrible Spill in Grand Bay
Source Institutions
In this activity, learners make a model of a pollution spill that occurred at Bangs Lake in Mississippi and measure water quality parameters in their model.
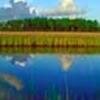
Make a Lake
Source Institutions
Where rainwater goes after the rain stops? And why there are rivers and lakes in some parts of the land but not in others?
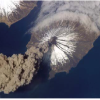
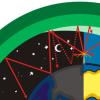
Earth and Mars
Source Institutions
Based on color photographic images, learners compare geological features on Earth and Mars to understand similarities and differences between the two planets, and consider the forces that created land
Ice on Mars
Source Institutions
In this activity, learners use sand and ice cubes to create a model of permafrost and the effects of the ice melting through the surface.