Search Results
Showing results 21 to 40 of 125
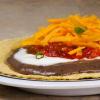
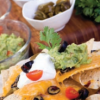
Creating Tostadas
Source Institutions
In this activity, learners develop their understanding of combinations as they create as many different kinds of tostadas as possible.
Starburst® Graph
Source Institutions
In this activity, learners use Starburst® candy to sort, classify, compare, and graph. Learners grab a handful of one-inch candy squares, sort them by color, graph the candy, and discuss the results.
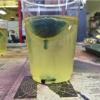
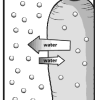
Oily Ice
Source Institutions
In this activity, learners experiment with the density of ice, water, and oil. Learners will discover that the density of a liquid determines whether it will float above or sink below another liquid.
Ripening of Fruits and Vegetables
Source Institutions
In this activity, learners test the rate of ripening fruit and vegetables and use a chemical to inhibit the ripening process.
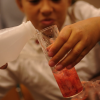
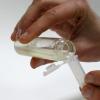
DNA Extraction
Source Institutions
Learners use a simple process to extract DNA from strawberries.

Build a Big Wheel
Source Institutions
In this activity, learners explore how engineers have developed big wheels or Ferris wheels.
Bend a Carrot
Source Institutions
In this activity, learners investigate the process of osmosis by adding salt to a sealed bag of raw carrots and comparing it to a control.
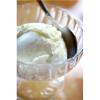
Can You Make Ice Cream in Two Minutes?
Source Institutions
In this demonstration, learners observe how liquid nitrogen both boils and freezes ingredients to make ice cream in two minutes.
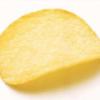
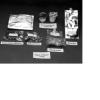
Ship the Chip
Source Institutions
In this activity, learners explore engineering package designs that meet the needs of safely shipping a product.
Serving Sizes
Source Institutions
In this nutrition and estimation activity (page 12 of PDF), learners estimate serving sizes of different foods and compare their estimates to serving size information provided on nutrition food labels
Amphibian Skin
Source Institutions
In this activity, learners explore the concept of permeability to better understand why amphibians are extremely sensitive to pollution.
Joe's Place
Source Institutions
In this math activity (Page 8 of the Dining Out! PDF), younger learners select items from a menu and count out the total amount needed using the fewest bills and coins possible.

Bake Sale
Source Institutions
This activity helps learners learn about math through a real-world scenario. Three friends are baking cookies for their school’s bake sale.
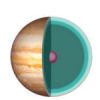
Jiggly Jupiter
Source Institutions
In this activity, learners build edible models of Jupiter and Earth to compare their sizes and illustrate the planets' internal layers.
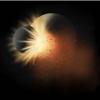
Future Moon: The Footsteps of Explorers
Source Institutions
In this activity, learners drop impactors onto layers of graham crackers!
DNA Nanotechnology
Source Institutions
In this activity, learners explore deoxyribonucleic acid (DNA), a nanoscale structure that occurs in nature.
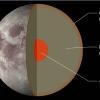
Recipe for a Moon
Source Institutions
In this activity, learners discover that the Moon, like Earth, is made up of layers of different materials. Learners work in teams to make models of the interiors of the Moon and Earth.
The Menu Game at the Terribly Terrific Taco
Source Institutions
In this math game (Page 15 of the Dining Out! PDF), learners figure discounts and/or profit increases for various food totals. Learners add decimals to $100.
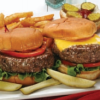
Experiment with Fat
Source Institutions
In this nutrition/food science activity, learners conduct an experiment and record data to compare the amount of fat in different foods.

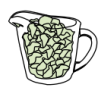
The Snack Shop
Source Institutions
In this math activity (Page 11 of the Dining Out! PDF), younger learners count out the total amount of money needed to purchase trail mix using the fewest number of bills/coins possible.