Search Results
Showing results 1 to 17 of 17

A Funny Taste
Source Institutions
In this activity, learners explore the different salinities of various sources of water by taste-testing.

A Recipe for Air
Learners use M&Ms® (or any other multi-color, equally-sized small candy or pieces) to create a pie graph that expresses the composition of air.
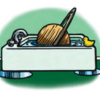
Dunking the Planets
Source Institutions
In this demonstration, learners compare the relative sizes and masses of scale models of the planets as represented by fruits and other foods.

The Scoop on Scallops
Source Institutions
In this data analysis activity, learners quantify the abundance and distribution of sea scallops in and adjacent to the Mid-Atlantic closed areas.
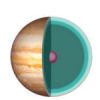
Jiggly Jupiter
Source Institutions
In this activity, learners build edible models of Jupiter and Earth to compare their sizes and illustrate the planets' internal layers.

Mapping Sea Level Rise
Source Institutions
In this activity related to climate change, learners create and explore topographical maps as a means of studying sea level rise.
Measuring and Protecting Skin
Source Institutions
In this activity, learners compare and contrast their own skin (including the area covered) with that of an orange.
Making Regolith
Source Institutions
This lesson will helps learners answer the question: How does the bombardment of micrometeoroids make regolith on the moon?

Chilean Sea Bass: Off the Menu
Source Institutions
In this data analysis activity, learners use data collected by the Commission for the Conservation of Antarctic Marine Living Resources (CCAMLR) to study Chilean sea bass populations.

Avogadro's Bubbly Adventure
Source Institutions
In this activity on page 7 of the PDF, learners investigate the solubility of gas in water at different temperatures. This experiment will help learners determine if temperature affects solubility.
Candy Chemosynthesis
Source Institutions
In this activity, groups of learners work together to create edible models of chemicals involved in autotrophic nutrition.
Sustainable Fishing
Source Institutions
In this activity, learners use a model for how fishing affects marine life populations, and will construct explanations for one of the reasons why fish populations are declining.
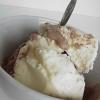
We all Scream for Ice Cream
Source Institutions
In this activity, learners observe how salinity affects the freezing point of water by making and enjoying ice cream.
Toast a Mole!
Source Institutions
In this quick activity, learners drink Avogadro's number worth of molecules - 6.02x10^23 molecules!
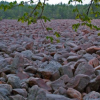
How Boulders Are Born
Source Institutions
In this activity, learners review and discuss weathering, erosion and mass wasting, to gain a stronger understanding of how Hickory Run’s Boulder Field was formed after the Laurentide Continental Glac
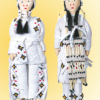
Plenty on the Plains
Source Institutions
In this activity, learners compare the ways of life of Plains Native Americans who hunted and moved frequently to follow the buffalo herds, and Native Americans who farmed and lived in more permanent
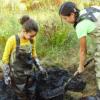
Bury Me Not!
Source Institutions
This activity (page 2 of the PDF under SciGirls Activity: Bogs) is a full inquiry investigation into decomposition.