Search Results
Showing results 1 to 20 of 21

Glaciers
Source Institutions
In this online activity, learners adjust mountain snowfall and temperature to see how glaciers grow and shrink. They will use scientific tools to measure thickness, velocity and glacial budget.

Earth's Energy Cycle: Albedo
Source Institutions
In this activity, learners experiment and observe how the color of materials that cover the Earth affects the amounts of sunlight our planet absorbs.

Terrestrial Hi-Lo Hunt
Source Institutions
In this outdoor activity, learners search for the warmest and coolest, windiest and calmest, wettest and driest, and brightest and darkest spots in an area.
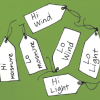
Sensory Hi-Lo Hunt
Source Institutions
In this outdoor activity, learners use only their senses to to find the extremes of several environmental variables or physical factors: wind, temperature, light, slope and moisture.
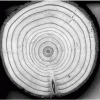
Trees: Recorders of Climate Change
Source Institutions
In this activity, learners are introduced to tree rings by examining a cross section of a tree, also known as a “tree cookie.” They discover how tree age can be determined by studying the rings and ho
The Carbon Cycle: How It Works
Source Institutions
In this game, learners walk through an imaginary Carbon Cycle and explore the ways in which carbon is stored in reservoirs and the processes that transport the carbon atom from one location to another
What's the Angle?
Source Institutions
This activity helps learners understand how the angle of the Sun affects temperatures around the globe.
Signs of Change: Studying Tree Rings
Source Institutions
In this very hands-on lesson, learners will investigate dendrochronology (the study of tree rings to answer ecological questions about the recent past) and come up with conclusions as to what possible
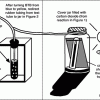
How Greenhouse Gases Absorb Heat
Source Institutions
Learners observe two model atmospheres -- one with normal atmospheric composition and another with an elevated concentration of carbon dioxide.
The Return of El Nino
Source Institutions
In this activity related to climate change and data analysis, learners examine temperature and precipitation data to determine if climate variations are due to El Niño.
Causes and Effects of Melting Ice
Source Institutions
In this activity, learners explore the concept of density-driven currents (thermohaline circulation) and how these currents are affected by climate change.
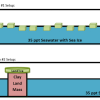
Effects of Solar Radiation on Land and Sea
Source Institutions
In this activity, learners explore the different heating properties of soil and water.

Saguaro Nest Cavities
Source Institutions
This activity (on page 3 of the PDF under GPS: Cactus Activity) is a full inquiry investigation into how some desert birds keep their cool.
Sand Dunes
Source Institutions
This outdoor activity (on page 2 of the PDF under SciGirls Activity: Sand Dunes) is a full inquiry investigation into how the amount of moisture in a sand dune relates to the number of plants growing

The Daily Ups and Downs
Source Institutions
In this activity, learners graph 48 hourly air temperatures from a local weather observation site and observe the diurnal temperature variations.

What's the Difference between Weather and Climate?
Source Institutions
In this interactive and informative group activity, learners use packages of M&M's to illustrate the difference between weather and climate.
Without An Ark: The Effects of Storms and Floods
Source Institutions
April showers bring May flowers, but what do coastal storms bring?
How is Coastal Temperature Influenced by the Great Lakes and the Ocean?
Source Institutions
In this two-part lesson, learners discover how large bodies of water can serve as a heat source or sink at different times and how proximity to water moderates climate along the coast.
Make Your Own Weather Station
Source Institutions
This three-part activity shows learners how to build three meteorology tools: a wind vane, a rain gauge, and a barometer.

Forward Thinking
Source Institutions
In this activity, learners create their own weather forecast map.