Search Results
Showing results 21 to 40 of 235
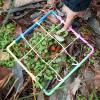
Counting With Quadrants
Source Institutions
Millions of organisms can live in and around a body of water.
Why Doesn’t the Ocean Freeze?
Source Institutions
In this activity, learners explore how salt water freezes in comparison to fresh water.
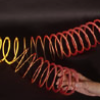
Seismic Slinky!
Source Institutions
Did you know that a Slinky makes a handy model of earthquake waves?
Glue Stick Sunset
Source Institutions
In this activity, learners explore why the sky is blue. Learners model the scattering of light by the atmosphere, which creates the blue sky and red sunset, using a flashlight and clear glue sticks.

A Cubic Foot Per Second
Source Institutions
In this activity, learners measure and calculate the amount of cubic feet various containers contain. Next, learners investigate cubic feet per second (cps), by carrying jugs in one second.

Whose Fault Is It?
Source Institutions
In this seismic simulation, learners play a "who-dunnit" game to explore earthquakes.

Arctic Sea Ice
Source Institutions
In this activity, learners explore how the area of Arctic sea ice has changed over recent years. First, learners graph the area of Arctic sea ice over time from 1979 to 2007.

It's a Gas, Man
Source Institutions
In this activity, learners discover if carbon dioxide has an effect on temperature.
Let's Count Humpback Whales: Environmental Effects on Population
Source Institutions
In this activity, learners use whale count data from the Hawaiian Islands Humpback Whale National Marine Sanctuary to compare whale counts in relation to environmental factors.

Twirling in the Breeze
Source Institutions
In this engineering activity, learners build a device (an anemometer) to measure how fast the wind is blowing.
Single Serving Volcanism
Source Institutions
In this activity, learners eat a snack and make a model of the plumbing system of a volcano.
Running in Circles
Source Institutions
In this group activity, learners use some common objects and work together to simulate the Coriolis effect. During the challenge, learners make predictions and test different scenarios.
Arctic Story Puzzles
Source Institutions
This activity has three story puzzles learners can solve to learn about life in the Arctic.
Make a Model Caldera
Source Institutions
In this quick activity (page 2 of PDF under GPS: Lava Flow Activity), learners will model how large depressions near the top of a volcano are formed by using an inflating and deflating balloon submerg
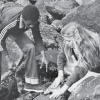
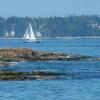
Rock Pioneers
Source Institutions
In this outdoor activity/field trip, learners investigate organisms that live along the ocean's rocky coast.

The Scoop on Scallops
Source Institutions
In this data analysis activity, learners quantify the abundance and distribution of sea scallops in and adjacent to the Mid-Atlantic closed areas.
Crunch Time
Source Institutions
In this quick and easy activity and/or demonstration, learners use two empty 2-liter bottles and hot tap water to illustrate the effect of heat on pressure.
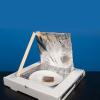
Cook Food Using the Sun
Source Institutions
Learners build a solar oven from a cardboard pizza box, aluminum foil and plastic. Learners can use their oven to cook S'mores or other food in the sun.
Sea State: Forecast Conditions at Sea
Source Institutions
In this oceanography and data collection activity, learners cast real time sea state conditions using buoys from NOAA's National Data Buoy Center.

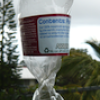
Percentage of Oxygen in the Air
Source Institutions
In this activity, learners calculate the percentage of oxygen in the atmosphere by using steel wool's ability to rust.