Search Results
Showing results 1 to 19 of 19

Whose Fault Is It?
Source Institutions
In this seismic simulation, learners play a "who-dunnit" game to explore earthquakes.

Arctic Sea Ice
Source Institutions
In this activity, learners explore how the area of Arctic sea ice has changed over recent years. First, learners graph the area of Arctic sea ice over time from 1979 to 2007.
The Shadow Knows II
Source Institutions
In this activity, learners will measure the length of a shadow and use the distance from the equator to calculate the circumference of the earth.
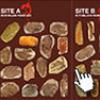
Prehistoric Climate Change
Source Institutions
In this online interactive, learners use fossils to infer temperatures 55 million years ago, at the sites where the fossils were found.
Inverted Foucault Pendulum
Source Institutions
In this demonstration, learners explore a variation of a Foucault pendulum, but upside down.
Determining the Amount of Transpiration from a Schoolyard Tree
Source Institutions
In this activity, learners calculate the number of milliliters of water a nearby tree transpires per day.
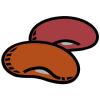
Not Just A Bag Of Beans
Source Institutions
In this activity, learners count and measure kidney beans to explore natural selection and variation. Learners measure the length of 50-100 beans.
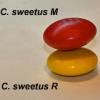
Survival of the Fittest: Variations in the Clam Species Clamys sweetus
Source Institutions
This guided inquiry three-part activity engages learners in thinking about the mechanism of natural selection by encouraging them to formulate questions that can be answered through scientific investi
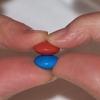
Survival of the Fittest: Battling Beetles
Source Institutions
This guided inquiry three-part activity engages learners in thinking about the mechanism of natural selection through data collection and pattern recognition.
Waves: An Alternative Energy Source
Source Institutions
In this data analysis and environmental science activity, learners evaluate the feasibility of wave energy as a practical alternative energy source using ocean observing system (OOS) buoys.
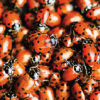
Ladybug Spots
Source Institutions
In this art/science/math activity, young learners are introduced to the concept of symmetry in nature.
Mass of the Earth
Source Institutions
In this activity, learners use basic measurements of the Earth and pieces of rock and iron to estimate the mass of the Earth.
Automotive Emissions and the Greenhouse Effect
Source Institutions
In this activity about global climate change, learners will conduct an experiment and collect data to compare the amount of carbon dioxide (CO2) in four different sources of gases.
Super Soaking Materials
Source Institutions
In this activity, learners will test cups full of potting soil, sand, and sphagnum moss to see which earth material is able to soak up the most water.
Super Soaker
Source Institutions
In this activity (page 1 of the PDF under SciGirls Activity: Bogs), learners will test cups full of potting soil, sand, and sphagnum moss to see which earth material is able to soak up the most water.
Oil Spot Photometer
Source Institutions
In this math activity related to light, learners assemble a photometer and use it to estimate the power output of the Sun.
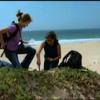
Sand Dunes
Source Institutions
This outdoor activity (on page 2 of the PDF under SciGirls Activity: Sand Dunes) is a full inquiry investigation into how the amount of moisture in a sand dune relates to the number of plants growing

Heat Capacity: Can't Take the Heat?
Source Institutions
Why is ocean water sometimes the warmest when the average daily air temperature starts to drop? In this activity, learners explore the differing heat capacities of water and air using real data.
Sea Turtle Populations
Source Institutions
In this activity (on page 2 of PDF under GPS: Sea Turtles Activity), learners will model how a sea turtle population changes over time, from eggs to adults, using puffed rice.