Search Results
Showing results 1 to 20 of 54
Glaciers
Source Institutions
In this online activity, learners adjust mountain snowfall and temperature to see how glaciers grow and shrink. They will use scientific tools to measure thickness, velocity and glacial budget.
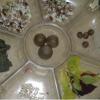
Glove Gardens
Source Institutions
In this activity, learners create a garden in a disposable glove. They learn about the conditions necessary to make the seeds sprout and actively participate in caring for their plants.
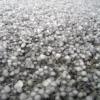
Sizing Up Hail
Source Institutions
In this activity, learners will estimate the sizes of balls to learn how to estimate the size of hail. Learners will compare their estimates to the estimates of their peers and the real measurements.
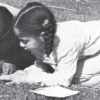
Bean Bugs
Source Institutions
In this outdoor biology and math activity, learners estimate the size of a population of organisms too numerous to count.
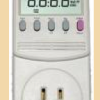
Plugged in to CO2
Source Institutions
In this activity, learners investigate various appliances and electronics, discovering how much energy each uses and how much carbon dioxide (CO2) is released to produce that energy.
Growing Plants: Track Their Growth
Source Institutions
In this activity, learners will be working with predictions with a time frame of one week, or longer. Start by planting seedlings.

A Cubic Foot Per Second
Source Institutions
In this activity, learners measure and calculate the amount of cubic feet various containers contain. Next, learners investigate cubic feet per second (cps), by carrying jugs in one second.
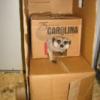
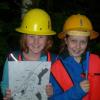
Animal House
Source Institutions
The goal of this activity is to design, build and test a house or toy for an animal.
Sea State: Forecast Conditions at Sea
Source Institutions
In this oceanography and data collection activity, learners cast real time sea state conditions using buoys from NOAA's National Data Buoy Center.

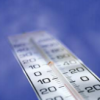
Measure the Pressure: The "Wet" Barometer
Source Institutions
In this activity, learners use simple items to construct a device for indicating air pressure changes.
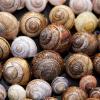
Measuring Biodiversity
Source Institutions
Learners use a variety of beans to represent a variety of species, and scatter these beans over a large piece of paper representing the environment.
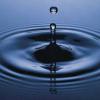
Earth's Water: A Drop in Your Cup
Source Institutions
This creative lesson plan provides a visual way for learners to gain knowledge about the finite amount of fresh water on Earth and encourages the discussion of the various ways to conserve this resour
Weather Stations: Temperature and Pressure
Source Institutions
In this activity, learners discover the relationship between temperature and pressure in the lower atmospheres of Jupiter and Earth.
Piles of Paper: Estimate Paper Use
Source Institutions
In this activity, learners keep track of how much paper the group uses in a week. Build awareness of paper waste, while strengthening measurement and estimation skills.
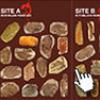
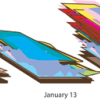
Prehistoric Climate Change
Source Institutions
In this online interactive, learners use fossils to infer temperatures 55 million years ago, at the sites where the fossils were found.
Measuring and Protecting Skin
Source Institutions
In this activity, learners compare and contrast their own skin (including the area covered) with that of an orange.
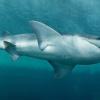
Shark Sizes
Source Institutions
In this graphing exercise (page 2 of the pdf), learners compare their own height to the length of various sharks.
Tree Growth Investigation
Source Institutions
This activity (located on page 3 of the PDF under GPS: Temperate Rain Forest Activity) is a full inquiry investigation into tree growth rates.
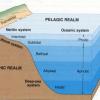
Introduction to Ocean Zones
Source Institutions
In this activity, learners will create a diagram of the ocean zones and determine what organisms live in each zone.
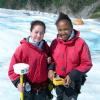
Mini Glacier Meltdown
Source Institutions
This activity (located on page 3 of the PDF under GPS: Glaciers Activity) is a full inquiry investigation about the different causes of glacial melt.