Search Results
Showing results 1 to 20 of 53
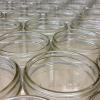
Hot Stuff!: Investigation #4
Learners test two jars containing soil, one covered and one open, for changes in temperature. After placing the jars in the Sun, learners discover that the covered jar cools down more slowly.

Dripping Wet or Dry as a Bone?
Learners investigate the concept of humidity by using a dry and wet sponge as a model. They determine a model for 100% humidity, a sponge saturated with water.
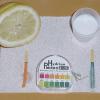
Acid (and Base) Rainbows
Learners use red cabbage juice and pH indicator paper to test the acidity and basicity of household materials. The activity links this concept of acids and bases to acid rain and other pollutants.

Hot Stuff!: Investigation #1
Learners test two jars, one containing plain air and one containing carbon dioxide gas, to see their reactions to temperature changes.

Good News: We're on the Rise!
Learners build a simple aneroid barometer to learn about changes in barometric pressure and weather forecasting. They observe their barometer and record data over a period of days.

Acid Rain Effects
Learners conduct a simple experiment to model and explore the harmful effects of acid rain (vinegar) on living (green leaf and eggshell) and non-living (paper clip) objects.

Earth's Energy Cycle: Albedo
Source Institutions
In this activity, learners experiment and observe how the color of materials that cover the Earth affects the amounts of sunlight our planet absorbs.
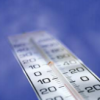
Weather Stations: Temperature and Pressure
Source Institutions
In this activity, learners discover the relationship between temperature and pressure in the lower atmospheres of Jupiter and Earth.

Hot Stuff!: Testing for Carbon Dioxide from Our Own Breath
Learners blow into balloons and collect their breath--carbon dioxide gas (CO2). They then blow the CO2 from the balloon into a solution of acid-base indicator.

A Merry-Go-Round for Dirty Air
Learners build a model of a pollution control device--a cyclone. A cyclone works by whirling the polluted air in a circle and accumulating particles on the edges of the container.
The Carbon Cycle: How It Works
Source Institutions
In this game, learners walk through an imaginary Carbon Cycle and explore the ways in which carbon is stored in reservoirs and the processes that transport the carbon atom from one location to another
Moving Without Wheels
In a class demonstration, learners observe a simple water cycle model to better understand its role in pollutant transport.
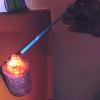
Hot Stuff!: Carbon Dioxide Extinguishes a Flame
In this demonstration, learners observe vinegar and baking soda creating carbon dioxide (CO2) in a bottle. The gas is poured out of a bottle onto a candle flame, putting out the candle.

Earth Atmosphere Composition
Source Institutions
In this activity, learners use rice grains to model the composition of the atmosphere of the Earth today and in 1880. Learners assemble the model while measuring percentages.
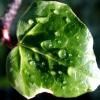
Leaf it to Me
Source Institutions
In this activity, learners observe the effect of transpiration as water is moved from the ground to the atmosphere.
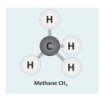
Let's Make Molecules
Source Institutions
In this activity, learners use gumdrops and toothpicks to model the composition and molecular structure of three greenhouse gases: carbon dioxide (CO2), water vapor (H2O) and methane (CH4).

Drawing Conclusions
Source Institutions
In this weather forecasting activity, learners determine the location of cold and warm fronts on weather plot maps.
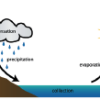
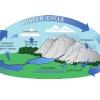
The Water Cycle
Source Institutions
Did you know that the water we use today is the same water found on Earth millions of years ago? The Earth constantly uses and recycles water in a process called the water cycle.

Hot Stuff!: Creating and Testing for Carbon Dioxide
In this demonstration, learners observe vinegar and baking soda reacting to form carbon dioxide (CO2) gas.

Hot Stuff!: Testing Ice
In this demonstration, learners compare and contrast regular water ice to dry ice (frozen carbon dioxide). Both samples are placed in a solution of acid-base indicator.