Search Results
Showing results 21 to 40 of 44
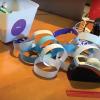
Paper Chain Testing
Source Institutions
Learners will do an experiment to determine which type of paper is strongest while focusing on variables and collecting data.
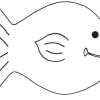
Generating and Recording Data
Source Institutions
In this math activity, learners use a "function machine" to collect and organize simple data. The function machine in this case is a cardboard box and the input/output data are paper fish.
Quick Questions: Learn About Data
Source Institutions
In this activity, learners will collect and analyze data to learn about the people around them. How many letters in everyone’s first name? What’s the most common number of letters?
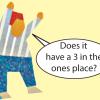
Mystery Number
Source Institutions
Combine logic and numbers in this game for all ages. Players start with a 10x10 grid of the numbers 1 to 100. One person chooses a secret number and announces the range in which it falls.

Lift Off!
Source Institutions
This activity (on page 2 of the PDF under SciGirls Activity: Lift Off) is a full inquiry investigation into the engineering challenges of sending scientific sensors into space.
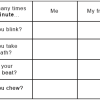
Blink
Source Institutions
In this self-measuring activity, learners observe and record how many times a minute they blink, take a breath, and chew, as well as how many times a minute their heart beats.
Patterns in Pixels
Source Institutions
This activity (page 2) draws upon a familiar, computer-based concept related to visual resolution: pixilation.
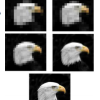
Tree Tally
Source Institutions
In this outdoor activity and fun race, learners first find the most common type of tree in a forest site.
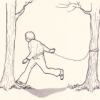
Balance Challenge
Source Institutions
In this quick activity, learners take a balance challenge to measure their average balance time. As they collect data, they investigate how practice and repetition improve their balance time.
Without An Ark: The Effects of Storms and Floods
Source Institutions
April showers bring May flowers, but what do coastal storms bring?
Is It Possible: Estimating Measurement
Source Institutions
In this activity, learners will decide together on a question about how far, long or high the group could reach together.
Let's Count Humpback Whales: Environmental Effects on Population
Source Institutions
In this activity, learners use whale count data from the Hawaiian Islands Humpback Whale National Marine Sanctuary to compare whale counts in relation to environmental factors.
Coastal Erosion: Where's the Beach?
Source Institutions
Learners use beach profile data from a local beach or online data from Ocean City, Maryland to investigate coastal erosion and sediment transport.
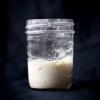
Wild Sourdough
Source Institutions
In this activity, learners explore chemistry and the microbial world by making their own sourdough starter and bread at home using only flour and water.
Fruity-Glows: Pictures of Health on a Microarray Canvas
Source Institutions
In this activity (page 12), learners apply the concepts of pixilation and pointillism to the world of biomedical science.
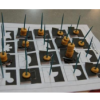
Starburst® Graph
Source Institutions
In this activity, learners use Starburst® candy to sort, classify, compare, and graph. Learners grab a handful of one-inch candy squares, sort them by color, graph the candy, and discuss the results.
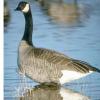
Canada Goose: Explore Trends With Data
Source Institutions
In this activity, learners will explore trends in Canada goose populations using real data from the National Audubon Society's Christmas Bird Count.
Catch & Release II: It's Catching On!
Source Institutions
Throw that fish back? A new generation of ethical anglers concerned about conserving resources is participating in "catch and release" fishing. How is this going?
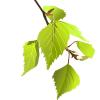
Exercise in Creating Drawings for Field Notebooks
Source Institutions
Learners draw and describe a leaf, and then re-find leaves drawn and described by other learners. Learners can observe leaves outside, or leaves may be brought into the classroom.
Paper Bag Skits: Using Size and Measurement
Source Institutions
Put the math of measurement, numbers, and everyday life into improvisational skits.