Search Results
Showing results 1 to 8 of 8
Tropical Belt
Source Institutions
This lesson familiarizes learners with the term "tropical belt." First, learners locate the equator, Tropic of Cancer and Tropic of Capricorn on a map and trace these lines with a crayon.
To Topo Two
Source Institutions
In this activity, two groups of learners create two separate landform models out of clay (mountains and valleys).

Create a Pasta Population Map
Source Institutions
Learners work as a group to create a map of their community. They use pasta to represent people, and glue the pasta on their maps to show areas of large population.
Map That Habitat
Source Institutions
Historically, sea floor mapping (bathymetry) was done by soundings.
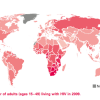
Mapping the Spread of HIV/AIDS: Trailing the Pandemic
Source Institutions
In this activity, learners act as epidemiologists by mapping the prevalence of HIV/AIDS worldwide.

Energy Use in the Americas
Source Institutions
Learners explore the relationship between energy consumption, population, and carbon emissions in the countries of the Americas.

If Anyone Can, Icon
Source Institutions
In this activity, learners create their own icons for a forecast-at-a-glance poster for their classroom/learning space.
Tourist Town: Dominating Sets
Source Institutions
In this activity, learners use a fictitious map of "Tourist Town" and counters to problem solve how to place ice-cream vans on street intersections so that every other intersection is connected to one