Search Results
Showing results 1 to 15 of 15
Let's Count Humpback Whales: Environmental Effects on Population
Source Institutions
In this activity, learners use whale count data from the Hawaiian Islands Humpback Whale National Marine Sanctuary to compare whale counts in relation to environmental factors.
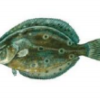
Fish Communities: National Marine Sanctuaries
Source Institutions
In this data activity, learners will compare and contrast fish communities, diversity and habitats in U.S. National Marine Sanctuaries.
Catch & Release II: It's Catching On!
Source Institutions
Throw that fish back? A new generation of ethical anglers concerned about conserving resources is participating in "catch and release" fishing. How is this going?
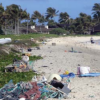
A Scientific Cleanup
Source Institutions
This is a comprehensive lesson plan on page 85 for a group cleanup trip to a local beach, lake or stream. Learners keep track of the types and amounts of trash picked up and analyze this information.
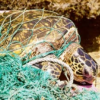
All Tangled Up
Source Institutions
In this activity on page 60, learners examine and simulate wildlife entanglement by experiencing what it might be like to be a marine animal trapped in debris.
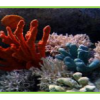
Corals and Chemistry
Source Institutions
In this activity, learners investigate how increased carbon dioxide (CO2) emissions from the burning of fossil fuels is changing the acidity (pH) of the ocean and affecting coral reefs and other marin
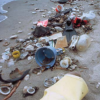
Trash Traits
Source Institutions
In this activity on page 24, learners perform experiments to examine whether or not trash can float, blow around, or wash away.

A Degrading Experience
Source Institutions
In this activity on page 27, learners perform an experiment to learn about how different types of marine debris degrade and how weather and sunlight affect the rate of degradation.
Ocean Home: Swimming Fishes
Source Institutions
In this activity, learners model, on a human-sized board game, how changes in water temperature may affect fish distributions and, ultimately, fisheries.
The Carbon Cycle Game
Source Institutions
In this activity, learners take on the role of a carbon atom and record which reservoirs in the carbon cycle they visit.
The Return of El Nino
Source Institutions
In this activity related to climate change and data analysis, learners examine temperature and precipitation data to determine if climate variations are due to El Niño.
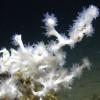
Harmful Algal Blooms: In Full Bloom
Source Institutions
In this activity, learners will investigate the impacts of harmful phytoplankton using NOAA's Coastal Services Center Harmful Algal Bloom Forecasting (HABF) Project data.

Corals on Acid
Source Institutions
The objective of this inquiry-based lesson is for learners to gain an understanding of how increasing ocean acidity can affect the calcification of marine organisms.
Off Base
Source Institutions
In this activity, learners explore the factors that tend to resist changes in pH of the ocean and why the ocean is becoming more acidic.

A Hurricane's Storm Surge Affects our Estuaries
Source Institutions
In this activity, learners construct a coastal landmass from sand and add features such as tidal creeks and barrier islands.