Search Results
Showing results 1 to 8 of 8
The Return of El Nino
Source Institutions
In this activity related to climate change and data analysis, learners examine temperature and precipitation data to determine if climate variations are due to El Niño.

Heat Capacity: Can't Take the Heat?
Source Institutions
Why is ocean water sometimes the warmest when the average daily air temperature starts to drop? In this activity, learners explore the differing heat capacities of water and air using real data.
Tsunami: Waves of Destruction
Source Institutions
In this activity, learners use tsunami time travel maps to predict how long it will take a tsunami to reach the shore.
Let's Count Humpback Whales: Environmental Effects on Population
Source Institutions
In this activity, learners use whale count data from the Hawaiian Islands Humpback Whale National Marine Sanctuary to compare whale counts in relation to environmental factors.
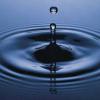
Earth's Water: A Drop in Your Cup
Source Institutions
This creative lesson plan provides a visual way for learners to gain knowledge about the finite amount of fresh water on Earth and encourages the discussion of the various ways to conserve this resour
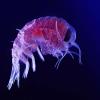
Amphipods: More than Mud
Source Institutions
In this data analysis and environmental science activity, learners examine the effects of pollution on amphipods using data from the Chesapeake Ecotox Research Program.
Earth's Water: A Drop in Your Cup
Source Institutions
This creative lesson plan provides a visual way for learners to gain knowledge about the finite amount of fresh water on Earth and encourages the discussion of the various ways to conserve this resour
Harmful Algal Blooms: In Full Bloom
Source Institutions
In this activity, learners will investigate the impacts of harmful phytoplankton using NOAA's Coastal Services Center Harmful Algal Bloom Forecasting (HABF) Project data.