Search Results
Showing results 1 to 20 of 25
Ramps 1: Let it Roll!
Source Institutions
In this activity about ramps, learners explore and measure the rate at which spherical objects roll down a ramp.
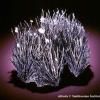
Watching Crystals Grow
Source Institutions
Learners will compare the growth rate and appearance of crystals forming on small rocks to those growing on miscellaneous objects. Learners will also investigate how temperature (warm vs.
Measure the Speed of a Water Leak
Source Institutions
In this activity (page 2 of PDF under GPS: Glaciers Activity), learners will measure the rate at which water streams out of a leaky cup.
Growing Plants: Track Their Growth
Source Institutions
In this activity, learners will be working with predictions with a time frame of one week, or longer. Start by planting seedlings.
Paper Tape Motion Timer
Source Institutions
In this activity, learners build a recording timer made from simple materials (e.g., small dc motor, sharpie pen, craft sticks, adding machine paper tape, etc.).
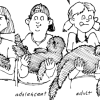
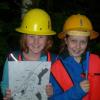
Malformed Frogs
Source Institutions
This activity (on page 2 of the PDF under SciGirls Activity: Malformed Frogs) is a full inquiry investigation into using indicator species to assess the health of an environment.
Testing Falling Peanut Butter Sandwich Myth
Source Institutions
In this activity related to rotational inertia (page 1 of the PDF under SciGirls Activity: Microgravity), learners will use a bit of scientific experimenting to test if open-faced peanut butter sandwi
Blazing the Trail
Source Institutions
In this math lesson, learners estimate distances between landmarks and use a map and scales to determine the actual distances.
What's the Angle?
Source Institutions
This activity helps learners understand how the angle of the Sun affects temperatures around the globe.
Any Year Calendars
Source Institutions
This PDF contains 12 calendars (12 months). Each month contains activities about math. Things to do on familiar holidays (like July 4), less common holidays (like Backward Day), and any day.

The Pulse is Right
Source Institutions
In this online activity, learners measure their pulse rates and investigate how their pulses change when they engage in different activities.
How Many In a Minute
Source Institutions
In this activity, learners will keep track of how much they can do in one minute. Instructors can pick something everyone will do for a minute, such as jumping up and down or drawing stars.
Piles of Paper: Estimate Paper Use
Source Institutions
In this activity, learners keep track of how much paper the group uses in a week. Build awareness of paper waste, while strengthening measurement and estimation skills.
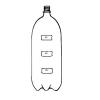
Under Pressure
Source Institutions
In this experiment, learners examine how pressure affects water flow. In small groups, learners work with water and a soda bottle, and then relate their findings to pressure in the deep ocean.
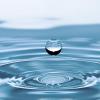
Drip, Drop, Drip, Drop
Source Institutions
In this math lesson, learners design an experiment to model a leaky faucet and determine the amount of water wasted due to the leak.
Otter Smorgasbord
Source Institutions
In this graphing activity (on pages 33-40), learners investigate how much and what kinds of food sea otter pups eat during their first year of life.
Great Steamboat Race
Source Institutions
In this outdoor activity, learners race small boats, made of cork, balsa wood, popsicle sticks etc., to investigate the rate and direction of currents in a stream or creek.
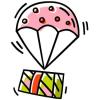
Algebra: Aw Chute!
Source Institutions
In this math lesson, learners determine and compare the rate of descent of various learner-constructed parachutes. Learners construct parachutes that will have maximum hang times.
Inverted Foucault Pendulum
Source Institutions
In this demonstration, learners explore a variation of a Foucault pendulum, but upside down.
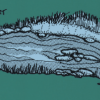
Tree Growth Investigation
Source Institutions
This activity (located on page 3 of the PDF under GPS: Temperate Rain Forest Activity) is a full inquiry investigation into tree growth rates.