Search Results
Showing results 1 to 9 of 9
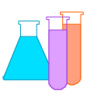
Plot the Dot: A Graphical Approach to Density
Source Institutions
In this activity, learners work in groups to determine the mass and volume of four samples: glass marbles, steel washers or nuts, pieces of pine wood, and pieces of PVC pipe.
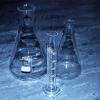
Linear Functions: Mystery Liquids
Source Institutions
In this math lesson, learners analyze the density of liquids in order to explore linear functions.
Rates of Change: Bottles and Divers
Source Institutions
In this math lesson (page 2 of the PDF), learners use bottles of various shapes to explore the abstract concept of rate of change.
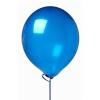
Up, Up, and Away
Source Institutions
In this math lesson, learners explore the real world meaning of slope. Learners conduct a balloon experiment in which they measure the circumference and flight time of deflating balloons.
Build a Bridge
Source Institutions
In this activity, learners use recycled materials to build a bridge that holds as many potatoes as possible. They investigate weight, height, strength, and measurement as they seek design solutions.
Modeling Tidal Action
Source Institutions
In this activity (Lesson 1), learners work in groups to create tide simulations.
Sizing Up Temperature
Source Institutions
In this activity, learners explore Charles' Law in a syringe.
Ride on a Slide: Toys or Tubes Ride Slopes and Angles
Source Institutions
This activity is a hit for family events and all ages—some will finish in 45 minutes; others can go on for hours.
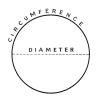
Pi Graph
Source Institutions
In this activity, learners use a straight line to learn about circles. Learners measure and record the diameter and circumference of different sized cylindrical objects on a chart.