Search Results
Showing results 1 to 19 of 19
Heating and Cooling of the Earth's Surface
Source Institutions
Learners conduct an experiment to determine the rate at which two materials, sand and water, heat up and cool down.
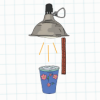
Insulation Station
Source Institutions
In this physical sciences activity, learners explore insulation. Leaners investigate how insulation can be used to slow down the conduction of heat from one side of a wall to the other.
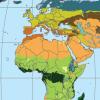
Discovering Rainforest Locations
Source Institutions
In this activity, learners will examine various world data maps to combine the information and predict which areas could be tropical rainforests.
Light on Other Planets
Source Institutions
In this math-based activity, learners model the intensity of light at various distances from a light source, and understand how astronomers measure the amount of sunlight that hits our planet and othe
Let's Dew It!
Source Institutions
From the Weather Watchers featured theme on the CYBERCHASE website. Learners will conduct experiments to discover how air temperature and humidity work together to make condensation, dew, and fog.

Avogadro's Bubbly Adventure
Source Institutions
In this activity on page 7 of the PDF, learners investigate the solubility of gas in water at different temperatures. This experiment will help learners determine if temperature affects solubility.
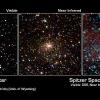
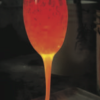
Colors of Stars
Source Institutions
In this activity, learners observe colors in the flame of a burning candle to explore connections between matter, light, color and temperature -- basic concepts of matter and energy.
What's the Angle?
Source Institutions
This activity helps learners understand how the angle of the Sun affects temperatures around the globe.
Our Solar System to Scale
Source Institutions
In this activity, learners plan and create a 24-foot long, two-dimensional model of our solar system, and compare and contrast the differences between planets and the sun.
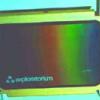
Liquid Crystal Thermometers
Source Institutions
In this activity, learners explore liquid crystal thermometers to observe how heat flows by conduction, convection, radiation, and evaporation.
Sodium Acetate Hand Warmers
Source Institutions
In this activity, sodium acetate hand warmers are used to introduce learners to supersaturated solutions, crystallization, and exothermic reactions.
How Greenhouse Gases Absorb Heat
Source Institutions
Learners observe two model atmospheres -- one with normal atmospheric composition and another with an elevated concentration of carbon dioxide.
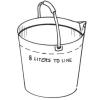
Metric Capers
Source Institutions
In this outdoor activity, learners measure familiar objects in nature to practice working with the metric system.

Terrestrial Hi-Lo Hunt
Source Institutions
In this outdoor activity, learners search for the warmest and coolest, windiest and calmest, wettest and driest, and brightest and darkest spots in an area.
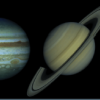
Planet Surfing
Source Institutions
In this astronomy activity (page 6 of the PDF), learners will compare and contrast two planets in the solar system using data obtained from the internet.

Drawing Conclusions
Source Institutions
In this weather forecasting activity, learners determine the location of cold and warm fronts on weather plot maps.
Hot Stuff!
Source Institutions
In this activity, learners discover that sand is the major ingredient in glass.

Heat Capacity: Can't Take the Heat?
Source Institutions
Why is ocean water sometimes the warmest when the average daily air temperature starts to drop? In this activity, learners explore the differing heat capacities of water and air using real data.

Discovering Rainforest Locations
Source Institutions
In this activity, learners will examine various world data maps to combine the information and predict which areas could be tropical rainforests.