Search Results
Showing results 21 to 40 of 41
I Can't Take the Pressure!
Learners develop an understanding of air pressure in two different activities.
Weather Vane
Source Institutions
In this meteorology activity, learners build weather vanes using straws, paperclips, and cardstock.

The Daily Ups and Downs
Source Institutions
In this activity, learners graph 48 hourly air temperatures from a local weather observation site and observe the diurnal temperature variations.
Measuring the Wind
Source Institutions
In this activity, learners explore how anemometers work to record wind speeds and how the equipment has undergone engineering adaptations over time.
Wonderful Weather
Source Institutions
In this activity, learners conduct three experiments to examine temperature, the different stages of the water cycle, and how convection creates wind.

What's the Difference between Weather and Climate?
Source Institutions
In this interactive and informative group activity, learners use packages of M&M's to illustrate the difference between weather and climate.
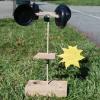
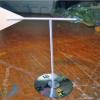
Weather Vane and Anemometer
Source Institutions
In this meteorology activity, learners construct simple devices to measure the direction and speed of wind.
Without An Ark: The Effects of Storms and Floods
Source Institutions
April showers bring May flowers, but what do coastal storms bring?
How is Coastal Temperature Influenced by the Great Lakes and the Ocean?
Source Institutions
In this two-part lesson, learners discover how large bodies of water can serve as a heat source or sink at different times and how proximity to water moderates climate along the coast.
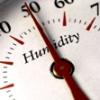
Making Sense of Sensors
Source Institutions
In this activity, learners explore sensors and focus specifically on how to measure humidity using a sensor.
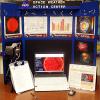
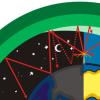
Space Weather Action Center
Source Institutions
In this interdisciplinary activity, learners create a Space Weather Action Center (SWAC) to monitor solar storms and develop real SWAC news reports.
Do Cities Affect the Weather?
Source Institutions
In this activity, learners explore clouds and how they form.

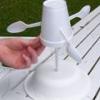
Twirling in the Breeze
Source Institutions
In this engineering activity, learners build a device (an anemometer) to measure how fast the wind is blowing.

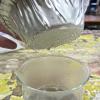
Measure the Pressure: The "Wet" Barometer
Source Institutions
In this activity, learners use simple items to construct a device for indicating air pressure changes.
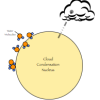
Cloud Fun
Source Institutions
Learners complete a series of hands-on and investigative activities to explore cumulus clouds.

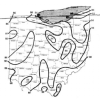
A Hurricane's Storm Surge Affects our Estuaries
Source Institutions
In this activity, learners construct a coastal landmass from sand and add features such as tidal creeks and barrier islands.
Running in Circles
Source Institutions
In this group activity, learners use some common objects and work together to simulate the Coriolis effect. During the challenge, learners make predictions and test different scenarios.

Forward Thinking
Source Institutions
In this activity, learners create their own weather forecast map.
AM in the PM
Source Institutions
In this activity, learners will listen to as many radio stations as possible to discover that AM radio signals can travel many hundreds of miles at night.

Measure the Pressure II: The "Dry" Barometer
Source Institutions
In this activity, learners use simple items to construct a device for indicating air pressure changes.