Search Results
Showing results 1 to 8 of 8

The Scoop on Scallops
Source Institutions
In this data analysis activity, learners quantify the abundance and distribution of sea scallops in and adjacent to the Mid-Atlantic closed areas.

Rooftop Gardens
How does a green roof, or roof covered by plants, affect the temperature of the inside and outside of a building? Learners design and build houses to find out the answer.

Chilean Sea Bass: Off the Menu
Source Institutions
In this data analysis activity, learners use data collected by the Commission for the Conservation of Antarctic Marine Living Resources (CCAMLR) to study Chilean sea bass populations.
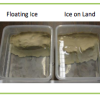
Sea Level: On The Rise
Source Institutions
Learners will understand the relationship between climate change and sea-level rise.
Investigating Ice Worlds
Source Institutions
In this activity about the solar system, learners use various light sources to examine ice with different components to understand how NASA studies planets and moons from space.

Earth Atmosphere Composition
Source Institutions
In this activity, learners use rice grains to model the composition of the atmosphere of the Earth today and in 1880. Learners assemble the model while measuring percentages.
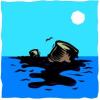
Oil Spill Cleanup
This hands-on experiment will provide learners with an understanding of the issues that surround environmental cleanup.
Without An Ark: The Effects of Storms and Floods
Source Institutions
April showers bring May flowers, but what do coastal storms bring?