Search Results
Showing results 81 to 100 of 133
Tsunami: Waves of Destruction
Source Institutions
In this activity, learners use tsunami time travel maps to predict how long it will take a tsunami to reach the shore.
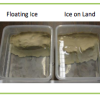
Sea Level: On The Rise
Source Institutions
Learners will understand the relationship between climate change and sea-level rise.
Fish Eyes: More than Meets the Eye
Source Institutions
In this data collection and analysis activity, learners evaluate fish physiology and ecology using vision research data from Dr.
Going Green
Source Institutions
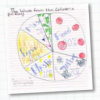
In this activity, learners conduct a waste audit and use their findings to implement a plan for reducing trash.
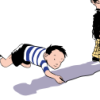
Shadow Play
Source Institutions
In this three part activity, learners explore and experiment with shadows to learn about the Sun's relative motion in the sky.
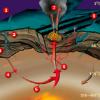
Candy Chemosynthesis
Source Institutions
In this activity, groups of learners work together to create edible models of chemicals involved in autotrophic nutrition.
Mini Glacier Meltdown
Source Institutions
This activity (located on page 3 of the PDF under GPS: Glaciers Activity) is a full inquiry investigation about the different causes of glacial melt.
Tree Trunk Diameter to Branch Height Relationship
Source Institutions
In this activity (located on page 2 of the PDF under GPS: Temperate Rain Forest Activity), learners will identify a group of deciduous trees to study.
Wind Tunnel Testing
Source Institutions
In this activity, learners explore how wind tunnels provide feedback to engineers about the performance and durability of products such as planes, cars, and buildings.
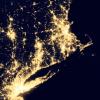
Where Do We Choose to Live and Why?
Source Institutions
In this geography investigation, learners use a nighttime satellite image to observe areas of light across the United States and to identify patterns and spatial distributions of human settlements.
Create a Coral Reef
Source Institutions
Educator Amy O'Donnell from the American Museum of Natural History guides learners to create a diorama of a coral reef.

The Dead Zone: A Marine Horror Story
Source Institutions
In this environmental science and data analysis activity, learners work in groups to track a Dead Zone (decreased dissolved oxygen content of a body of water) using water quality data from the Nutrien
Without An Ark: The Effects of Storms and Floods
Source Institutions
April showers bring May flowers, but what do coastal storms bring?
Water Rocket Launch
Source Institutions
In this activity, learners explore rocketry and the principals of space flight.
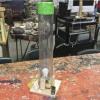
Wind Tube
Source Institutions
In this activity, learners explore moving air and the physics of lift and drag by constructing homemade wind tunnels.
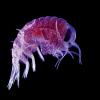
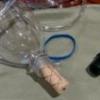
Plankton Races
Source Institutions
In this two-part activity, learners investigate buoyancy, density and surface area as well as biodiversity and the relationship between the structure and function of organisms.
How is Coastal Temperature Influenced by the Great Lakes and the Ocean?
Source Institutions
In this two-part lesson, learners discover how large bodies of water can serve as a heat source or sink at different times and how proximity to water moderates climate along the coast.
Modeling the Night Sky
Source Institutions
In this two-part activity, learners explore the Earth and Sun's positions in relation to the constellations of the ecliptic with a small model.

Chilean Sea Bass: Off the Menu
Source Institutions
In this data analysis activity, learners use data collected by the Commission for the Conservation of Antarctic Marine Living Resources (CCAMLR) to study Chilean sea bass populations.
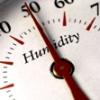
Making Sense of Sensors
Source Institutions
In this activity, learners explore sensors and focus specifically on how to measure humidity using a sensor.