Search Results
Showing results 1 to 10 of 10
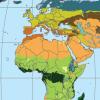
Discovering Rainforest Locations
Source Institutions
In this activity, learners will examine various world data maps to combine the information and predict which areas could be tropical rainforests.

Understanding Albedo
Source Institutions
In this activity related to climate change, learners examine albedo and the ice albedo feedback effect as it relates to snow, ice, and the likely results of reduced snow and ice cover on global temper
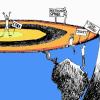
Earth Walk
Source Institutions
In this hands-on and feet-on excursion, learners take a science walk to visualize the planet's immense size and numerous structures, without the usual scale and ratio dimensions found in most textbook
Inverted Bottles
Source Institutions
In this activity, learners investigate convection by using food coloring and water of different temperatures.
Trees: Recorders of Climate Change
Source Institutions
In this activity, learners are introduced to tree rings by examining a cross section of a tree, also known as a “tree cookie.” They discover how tree age can be determined by studying the rings and ho
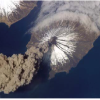
Earth and Mars
Source Institutions
Based on color photographic images, learners compare geological features on Earth and Mars to understand similarities and differences between the two planets, and consider the forces that created land
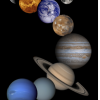
Habitable Worlds
Source Institutions
In this group activity, learners consider environmental conditions—temperature, presence of water, atmosphere, sunlight, and chemical composition—on planets and moons in our solar system to determine

Heat Capacity: Can't Take the Heat?
Source Institutions
Why is ocean water sometimes the warmest when the average daily air temperature starts to drop? In this activity, learners explore the differing heat capacities of water and air using real data.

Discovering Rainforest Locations
Source Institutions
In this activity, learners will examine various world data maps to combine the information and predict which areas could be tropical rainforests.
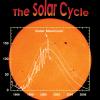
Solar Flip Book
Source Institutions
In this activity, learners make a flip book that shows the progression of two solar events on reversible sides of the flip book.