Search Results
Showing results 1 to 20 of 70
Disease Detective
Source Institutions
This activity (on pages 35-43) lets learners analyze a "herd of elk" to detect the spread of a bacterial disease called brucellosis.
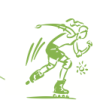
Hold a Hill
Source Institutions
In this outdoor activity, learners investigate the relationship between the slope of a trail and soil erosion.
Bean Bugs
Source Institutions
In this outdoor biology and math activity, learners estimate the size of a population of organisms too numerous to count.
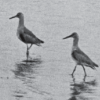
Flocking for Food
Source Institutions
In this outdoor beach activity, learners use a variety of "beaks" (such as trowels, spoons or sticks) to hunt for organisms that shore birds might eat.
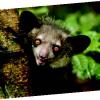
Aye-Aye
Source Institutions
This is an activity about the adaptations that allow the Aye-aye to survive in its habitat. Learners will explore how the Aye-aye collects food and how this is influenced by their specialized finger.
Animal Diversity
Source Institutions
In this outdoor activity, learners find, count and compare as many different kinds of animals as they can find in two different areas: a managed lawn and a weedy area.
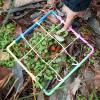
Counting With Quadrants
Source Institutions
Millions of organisms can live in and around a body of water.

Arctic Sea Ice
Source Institutions
In this activity, learners explore how the area of Arctic sea ice has changed over recent years. First, learners graph the area of Arctic sea ice over time from 1979 to 2007.
Coastal Erosion: Where's the Beach?
Source Institutions
Learners use beach profile data from a local beach or online data from Ocean City, Maryland to investigate coastal erosion and sediment transport.
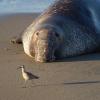
Natural Selection in Protected and Unprotected Populations
Source Institutions
In this simulation, learners model two elephant seal populations and how they change over time. Learners start with cards representing a variety of seals.
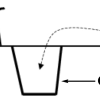
What Trickles Down?
Source Institutions
Learners design their own experiment to explore the permeability of different materials such as soil, sand, gravel, and marbles.
Measuring Biodiversity
Source Institutions
Learners use a variety of beans to represent a variety of species, and scatter these beans over a large piece of paper representing the environment.
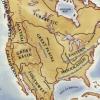
Woodlands Map
Source Institutions
This is a culminating activity which allows learners to summarize what they know about Woodlands Native Americans by creating illustrations and map symbols for a large outline map (see related Activit
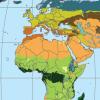
Discovering Rainforest Locations
Source Institutions
In this activity, learners will examine various world data maps to combine the information and predict which areas could be tropical rainforests.
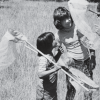
Hunting Minibeasts
Source Institutions
In this activity (p.6-10 of PDF), learners use different methods for hunting minibeasts (bugs). Learners can either make traps or simply look for minibeasts under stones and logs.

Mapping Sea Level Rise
Source Institutions
In this activity related to climate change, learners create and explore topographical maps as a means of studying sea level rise.

Mapping Greenhouse Gas Emissions Where You Live
Source Institutions
In this lesson plan, learners examine some of the of greenhouse gas emissions sources in their community.
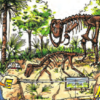
Dinosaur Interaction
Source Institutions
In this activity, learners explore why animals, specifically dinosaurs, live in families.
Your Energy Needs
Source Institutions
In this activity about the relationship between food and energy (page 8 of PDF), learners estimate average daily baseline energy (Calorie) needs and energy needs for different levels of activity.
This Bitter Be Good
Source Institutions
In this health and genetics activity, learners determine whether tasting the bitter compound PTC (phenylthiocarbamide) influences which vegetables a person likes.