Search Results
Showing results 1 to 20 of 69
Fold a Crystal
Source Institutions
Rocks are made of minerals, and minerals often have crystal shapes. In this fun activity about geometry in nature, learners create their own crystal shapes out of paper.
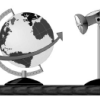
The Geophysical Light/Dark Cycle
Source Institutions
This is an activity (located on page 131 of the PDF) related to sleep and circadian rhythms as well as space travel.
Meteoroids and the Craters They Make
Source Institutions
In this activity, learners investigate the formation of craters. Learners will examine how the size, angle and speed of a meteorite's impact affects the properties of craters.
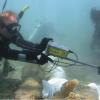
Excavating and Mapping Under Water
Source Institutions
In this archaeology activity, learners consider ways in which excavating an underwater site is different from excavating a terrestrial site.
Hold a Hill
Source Institutions
In this outdoor activity, learners investigate the relationship between the slope of a trail and soil erosion.
Investigating Density Currents
Source Institutions
In this lab activity, learners explore how to initiate a density current. Learners measure six flasks with different concentrations of salt and water (colored blue).
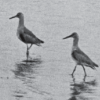
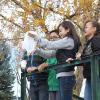
Flocking for Food
Source Institutions
In this outdoor beach activity, learners use a variety of "beaks" (such as trowels, spoons or sticks) to hunt for organisms that shore birds might eat.
Measure the Speed of a Water Leak
Source Institutions
In this activity (page 2 of PDF under GPS: Glaciers Activity), learners will measure the rate at which water streams out of a leaky cup.
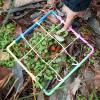
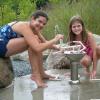
Counting With Quadrants
Source Institutions
Millions of organisms can live in and around a body of water.
Egg-cellent Landing
Learners recreate the classic egg-drop experiment with an analogy to the Mars rover landing. The concept of terminal velocity will be introduced, and learners perform several velocity calculations.

A Cubic Foot Per Second
Source Institutions
In this activity, learners measure and calculate the amount of cubic feet various containers contain. Next, learners investigate cubic feet per second (cps), by carrying jugs in one second.

Arctic Sea Ice
Source Institutions
In this activity, learners explore how the area of Arctic sea ice has changed over recent years. First, learners graph the area of Arctic sea ice over time from 1979 to 2007.
Coastal Erosion: Where's the Beach?
Source Institutions
Learners use beach profile data from a local beach or online data from Ocean City, Maryland to investigate coastal erosion and sediment transport.
How Big is Small
Source Institutions
In this classic hands-on activity, learners estimate the length of a molecule by floating a fatty acid (oleic acid) on water.
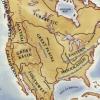
Woodlands Map
Source Institutions
This is a culminating activity which allows learners to summarize what they know about Woodlands Native Americans by creating illustrations and map symbols for a large outline map (see related Activit
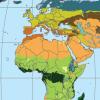
Discovering Rainforest Locations
Source Institutions
In this activity, learners will examine various world data maps to combine the information and predict which areas could be tropical rainforests.
Understanding Albedo
Source Institutions
In this activity related to climate change, learners examine albedo and the ice albedo feedback effect as it relates to snow, ice, and the likely results of reduced snow and ice cover on global temper

Mapping Sea Level Rise
Source Institutions
In this activity related to climate change, learners create and explore topographical maps as a means of studying sea level rise.
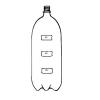
Under Pressure
Source Institutions
In this experiment, learners examine how pressure affects water flow. In small groups, learners work with water and a soda bottle, and then relate their findings to pressure in the deep ocean.

Mapping Greenhouse Gas Emissions Where You Live
Source Institutions
In this lesson plan, learners examine some of the of greenhouse gas emissions sources in their community.