Search Results
Showing results 1 to 20 of 34

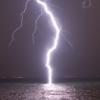
The Rumblin' Road: Determining distance to a Thunderstorm
Source Institutions
In this activity, learners discover how to determine the distance to a lightning strike or nearby thunderstorm.

Quadraphonic Wind
Source Institutions
In this activity, learners discover how the extent of various wind speeds changes in each of the four quadrants around a hurricane.
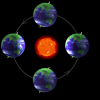
The Four Seasons
Source Institutions
In this lesson that includes hands-on activities and demonstrations, learners discover that it is the tilt of the Earth's axis (not its proximity to the sun) that causes the seasons.

Whose Fault Is It?
Source Institutions
In this seismic simulation, learners play a "who-dunnit" game to explore earthquakes.
Crunch Time
Source Institutions
In this quick and easy activity and/or demonstration, learners use two empty 2-liter bottles and hot tap water to illustrate the effect of heat on pressure.

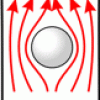
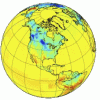
Why do Hurricanes go Counterclockwise in the Northern Hemisphere?
Source Institutions
In this kinesthetic activity, learners will play a game with a ball to demonstrate the Coriolis force, which partly explains why hurricanes in the Northern Hemisphere rotate counterclockwise.
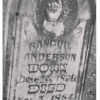
Gravestone Weathering
Source Institutions
In this activity (located on pages 9-14 of PDF), learners visit a cemetery to examine the distinguishing characteristics of rock weathering.
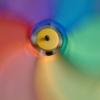
Toasty Wind
Source Institutions
In this quick activity, learners use a toaster to investigate the source for the Earth's wind. Learners hold a pinwheel above a toaster to discover that rising heat causes wind.
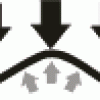
A Pressing Engagement
Source Institutions
In this quick and easy activity and/or demonstration, learners illustrate the effect of the weight of air over our heads.
The Carbon Cycle and its Role in Climate Change: Activity 2
Source Institutions
In this activity (on page 7), learners explore the meaning of a "carbon sink." Using simple props, learners and/or an educator demonstrate how plants act as carbon sinks and how greenhouse gases cause

Go with the Flow
Source Institutions
In this quick and easy activity and/or demonstration, learners use two empty soda cans to illustrate Bernoulli's principle.

The Daily Ups and Downs
Source Institutions
In this activity, learners graph 48 hourly air temperatures from a local weather observation site and observe the diurnal temperature variations.
Updrafts in Action
Source Institutions
In this weather activity/demonstration, learners watch as a ping pong ball is suspended in a stream of air supplied by a hair dryer.
Haunted by Hurricanes: Use Data to Learn About Hurricanes
Source Institutions
In this activity, learners will determine if the frequency and intensity of hurricanes are changing using real data from the National Hurricane Center.
The Return of El Nino
Source Institutions
In this activity related to climate change and data analysis, learners examine temperature and precipitation data to determine if climate variations are due to El Niño.
The Carbon Cycle: How It Works
Source Institutions
In this game, learners walk through an imaginary Carbon Cycle and explore the ways in which carbon is stored in reservoirs and the processes that transport the carbon atom from one location to another
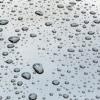
Conductivity: Salty Water
Source Institutions
Water, whether fresh or salty, serves as one of the best electrical conductors on the planet. Does salt effect its conductivity?
Tsunami: Waves of Destruction
Source Institutions
In this activity, learners use tsunami time travel maps to predict how long it will take a tsunami to reach the shore.
The Carbon Cycle: Carbon Tracker
Source Institutions
In this activity, learners play NOAA's Carbon Tracker game and discover ways to keep track of carbon dioxide and other greenhouse gases in the world.
Atmospheric Collisions
Source Institutions
In this activity/demonstration, learners observe what happens when two ping pong balls are suspended in the air by a hair dryer. Use this activity to demonstrate how rain drops grow by coalescence.